# Debugging Kong Requests: 7 Kong Gateway Troubleshooting Tips
Ahmed Koshok
Senior Staff Solutions Engineer, Kong
Simon Green
Developers will remember times when they were trying to figure out why something they were working on wasn’t behaving as expected. Hours of frustration, too much (or perhaps never enough) caffeine consumed, and *sotto voce* curses uttered. And then — as if by fate — the issue is narrowed down to a simple oversight that makes perfect sense upon discovery. Problem solved!
One of my favorite examples of this was with a colleague at my first job. We carefully reviewed our code over and over, and everything looked fine. But it wasn’t behaving as expected. We then noticed that our changes were reliably not being reflected no matter what they were. It turned out we were forgetting to compile our code once we shipped it to the server for execution. Oops! "We’re geniuses,” he said. We had a good laugh.
Kong Gateway, the world's most popular API gateway, is sure to frustrate some developers here and there. It’s software, and software is never perfect. In this guide, we’ll go through some methods I use when helping others figure out what went wrong.
## 1. Look at the headers, and use the Kong-Debug: 1 header when appropriate
When you make a call to Kong, it gives you information about your request. Let’s assume you made one, but it is not giving the expected result. In this example, we have [httpie](https://httpie.io/)httpie installed.
We are getting a `200 OK`, but the output is not what we expected. We see there is a 2ms latency for Kong, and a 6ms upstream latency. Kong is able to proxy the request. If the ‘X-Kong-Upstream-Latency’ header was zero or missing, then we know the request never made it to the upstream.
Let’s get more details. Are we going to the right upstream?
Aha! One of our fellow developers is having a little fun. They created a route that will catch anything in the request path that begins with the letter ‘p'.
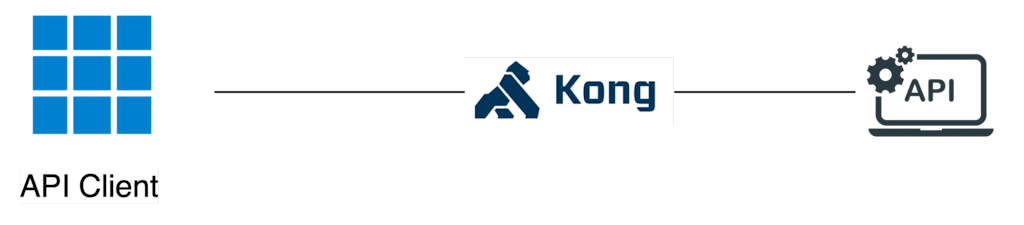
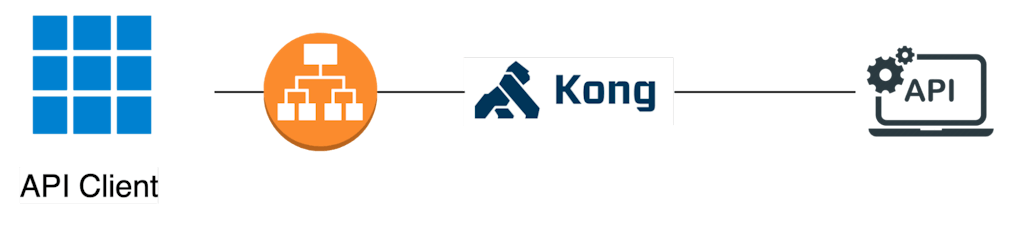
Here’s a fun example I was involved in not too long ago. We configured the mTLS plugin, but no matter what we did, we weren’t able to get our consumer identified and validated. Here’s a visualization of what we were trying to do.
It’s never this simple, is it? Kong was running in the cloud, which means we needed a load balancer to expose it externally. And sure enough, it was an application load balancer, which does the TLS termination.
Of course, Kong wasn’t getting the client's certificate. The ALB didn’t pass it along.
If you get stuck, try to draw an image of the components you’re working with. Draw it in your mind, on paper, or using your favorite application. You might find that you uncover areas that need further checking.
## 4. Is that feature there?
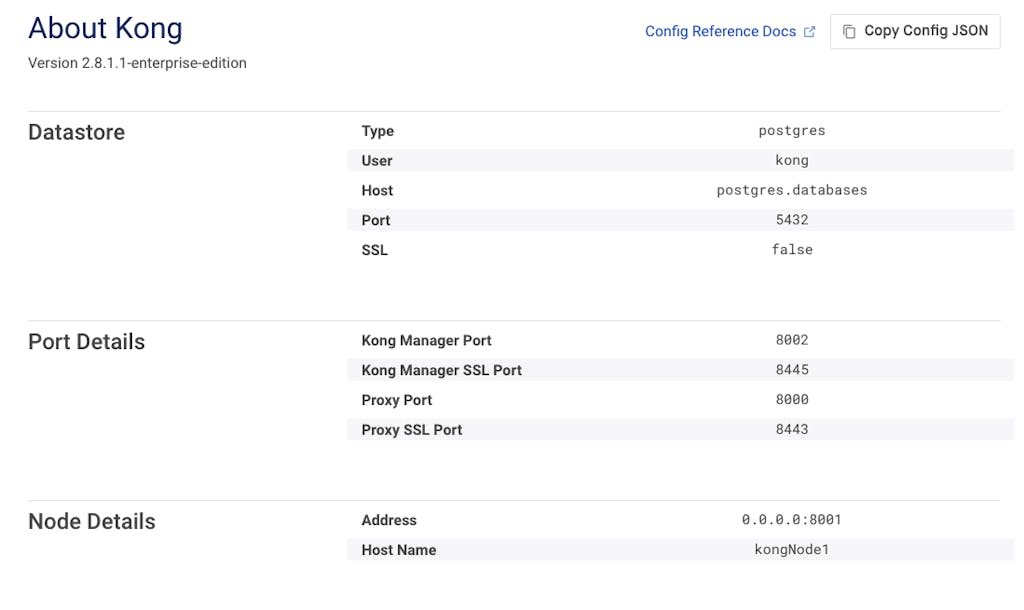
Here’s a small one: you read the docs, and you swear that you configured the feature properly. No matter what you do, the behavior isn’t what you expected! Let’s back up just a little. What version of Kong are you running?
Also, make sure to familiarize yourself with any breaking changes. These are rare, and may or may not apply to you, so be sure to scan a changelog to know if you need to make any alterations. It may save you hours of troubleshooting later.
*Note: This feature is deprecated, but it will be available at least until Kong 4.x. If you’re reading this article and the feature is no longer available, please use OTEL.*
tracing = on
tracing_write_strategy =filetracing_write_endpoint = /tmp/trace.log
tracing_types = all
tracing_debug_header = gimmieDatTrace
generate_trace_details = on
We now pass a header, `gimmieDatTrace`, as part of a debug request. Then we have a look at the `/tmp/trace.log` file. Aha! The trace section shows a Lambda plugin taking 68 ms. Of course, this isn’t within the Gateway's latency. The route in question is a serviceless one. The Lambda function is being called synchronously.
So we know we can tell the application team about the third suggestion in this article.
Let’s see if it works. There are over 650 articles as of the time this was published. We want to log additional fields into our ELK stack. Let’s search for ‘logging'. And it’s the first hit. (It’s a good day already.)
As per the article, we can log requests, responses, custom headers, and fields. In fact, someone already used this feature with a logging filter:
We sometimes wonder if software is deterministic. Given that it’s digital, it must be, right? If a behavior is repeatable under certain conditions, then it’s fixable. It’s only a matter of getting the necessary details.
We hope this short guide helps you in your Kong projects and helps you reclaim some time solving puzzles — fun as they may be.
What You'll Build
To explore the new integration, I'll build a realistic API platform workflow using Konnect, Kong Gateway, and Insomnia.
By the end of this tutorial, I'll have:
A Konnect Control Plane (KongAir Dev)
A local Kong Gateway Data Pl
We're pleased to announce the launch of Standard Webhooks! Kong has been part of the Technical Committee of this standard with other great companies like Svix (the initiator of the project), Ngrok, Zapier, Twillio, Lob, Mux, and Supabase. This was
Vincent Le Goff
# Using Kong Gateway to Adapt SOAP Services to the JSON World
While JSON-based APIs are ubiquitous in the API-centric world of today, many industries adapted internet-based protocols for automated information exchange way before REST and JSON became popular. One attempt to establish a standardized protocol sui
As part of the Kong Gateway 2.6 release, we shipped a brand new jq plugin for anyone with an enterprise license to use. It’s like we combined the request and response transformer plugins to form a single, more powerful plugin—supercharging the w
Event Hooks is a new Kong Enterprise feature launched in the Kong Gateway 2.5 Release . This feature sends you notifications when certain events happen on your Kong Gateway deployment. Kong Gateway listens for events, like routes, services, consum
This tutorial shows you how to create a custom Kong Gateway plugin with Go programming language. The sample plugin I created adds an extra layer for security between consumers and producers. The way it works is it identifies consumers through a
Read the latest version: Kong Gateway Tutorial: Up and Running With a GUI in <15 Minutes Archived post below. You've decided to install Kong Gateway. Congrats! You're almost ready to accelerate your microservices journey with the world's most popul
Kevin Chen
# How to Test Gateway APIs Directly from Kong Konnect with Insomnia
What You'll Build
To explore the new integration, I'll build a realistic API platform workflow using Konnect, Kong Gateway, and Insomnia.
By the end of this tutorial, I'll have:
A Konnect Control Plane (KongAir Dev)
A local Kong Gateway Data Pl
We're pleased to announce the launch of Standard Webhooks! Kong has been part of the Technical Committee of this standard with other great companies like Svix (the initiator of the project), Ngrok, Zapier, Twillio, Lob, Mux, and Supabase. This was
Vincent Le Goff
# Using Kong Gateway to Adapt SOAP Services to the JSON World
While JSON-based APIs are ubiquitous in the API-centric world of today, many industries adapted internet-based protocols for automated information exchange way before REST and JSON became popular. One attempt to establish a standardized protocol sui
As part of the Kong Gateway 2.6 release, we shipped a brand new jq plugin for anyone with an enterprise license to use. It’s like we combined the request and response transformer plugins to form a single, more powerful plugin—supercharging the w
Event Hooks is a new Kong Enterprise feature launched in the Kong Gateway 2.5 Release . This feature sends you notifications when certain events happen on your Kong Gateway deployment. Kong Gateway listens for events, like routes, services, consum
This tutorial shows you how to create a custom Kong Gateway plugin with Go programming language. The sample plugin I created adds an extra layer for security between consumers and producers. The way it works is it identifies consumers through a
Read the latest version: Kong Gateway Tutorial: Up and Running With a GUI in <15 Minutes Archived post below. You've decided to install Kong Gateway. Congrats! You're almost ready to accelerate your microservices journey with the world's most popul
Kevin Chen
## Ready to see Kong in action?
Get a personalized walkthrough of Kong's platform tailored to your architecture, use cases, and scale requirements.