# Debugging Applications in Production with Service Mesh
Damon Sorrentino
As an application developer, have you ever had to troubleshoot an issue that only happens in production? Bugs can occur when your application gets released into the wild, and they can be extremely difficult to debug when you cannot reproduce without production data. In this blog, I am going to show you how to safely send your production data to development applications deployed using a service mesh to help you better debug and build production proof releases. For this how-to, we will use the [Kuma](http://kuma.io/)Kuma service mesh and a Kubernetes cluster.
To begin, let’s install the necessary pre-requisite software. First, connect to your Kubernetes cluster and install Kuma. Then, clone the following git [repository](https://github.com/Kong/blog-traffic-mirror)repository which contains the necessary files for this tutorial and change to the project directory.
Next, create and label namespaces for the applications and install Kuma:
% git clone https://github.com/Kong/blog-traffic-mirror.git% cd blog-traffic-mirror
blog-traffic-mirror % curl -L https://kuma.io/installer.sh | VERSION=2.0.0 sh -blog-traffic-mirror % export PATH=$PATH:./kuma-2.0.0/bin
blog-traffic-mirror % kumactl install control-plane | kubectl apply -f -
blog-traffic-mirror % kubectl get po -n kuma-system -w
NAME READY STATUS RESTARTS AGE
kuma-control-plane-7d567c7fb9-xs2fx 0/1 Running 0 2s
kuma-control-plane-7d567c7fb9-xs2fx 1/1 Running 0 11s
^C
*Note: At the time of this writing, Kuma is at version 2.0.0, so you may want to change VERSION to reflect the latest version.*
Let’s verify Kuma successfully installed by port forwarding and sending a request to the Kuma’s HTTP API. In a separate terminal window, execute the following command.
blog-traffic-mirror % kubectl port-forward svc/kuma-control-plane -n kuma-system 5681:5681 &
blog-traffic-mirror % curl http://localhost:5681/{"hostname":"kuma-control-plane-76d76dbc4b-f556m","tagline":"Kuma","version":"2.0.0","instanceId":"kuma-control-plane-76d76dbc4b-f556m-0c77","clusterId":"0c4430a0-d2dc-4cfe-bb65-21bd734013dc","gui":"The gui is available at /gui"}
Now let’s install all of the applications we are going to use. We are going to use Kong Gateway for ingress traffic into the mesh and mockbin.org as the application:
blog-traffic-mirror % kubectl apply -f https://bit.ly/kong-ingress-dblessblog-traffic-mirror % kubectl get po -n kong -w
NAME READY STATUS RESTARTS AGE
ingress-kong-7c4b795d5d-p5gln 0/3 Init:0/10 3s
ingress-kong-7c4b795d5d-p5gln 0/3 PodInitializing 0 5s
ingress-kong-7c4b795d5d-p5gln 0/3 Running 0 6s
ingress-kong-7c4b795d5d-p5gln 1/3 Running 0 10s
ingress-kong-7c4b795d5d-p5gln 2/3 Running 0 10s
ingress-kong-7c4b795d5d-p5gln 3/3 Running 0 20s
^C
In order to use metrics in Kuma, you must first enable a metrics “backend”. By setting a metrics backend to “prometheus”, this instructs Kuma to expose metrics from every proxy inside the mesh. The below snippet shows you the default mesh configuration:
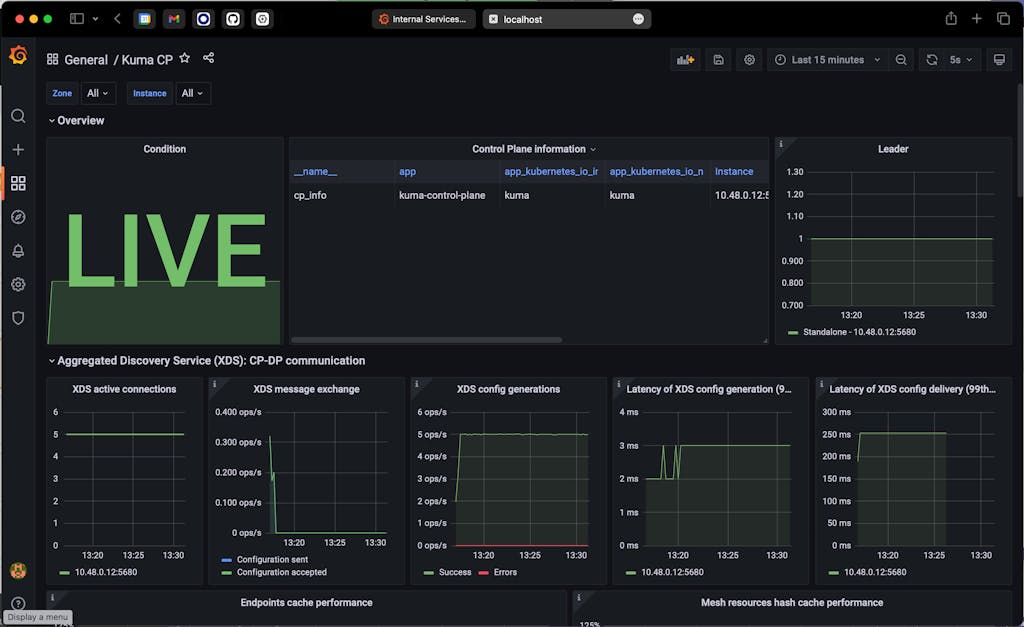
Click on [Grafana](http://localhost:8080/)Grafana and login using the default credentials (admin/admin). After you are logged into the admin console, find the Kuma CP dashboard, and you should see something similar to the below screen shot.
Next, create an Ingress for the mockbin application to call it with an external address:
blog-traffic-mirror % kubectl apply -f ingress.yaml -n myblog
ingress.networking.k8s.io/mockbin created
Get the external address of the mockbin service:
blog-traffic-mirror % kubectl get ing -n myblog
NAME CLASS HOSTS ADDRESS PORTS AGE
mockbin <none> * 34.173.171.1543000 18s
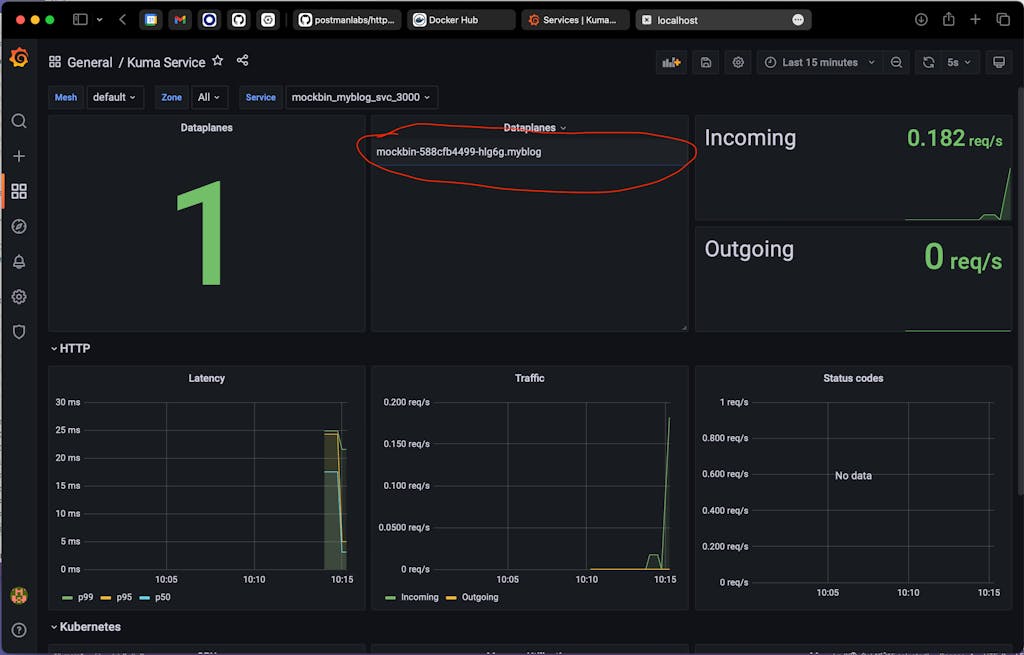
After the above command executes for a bit, find the Kuma Service dashboard in Grafana and select `mockbin_myblog_svc_3000` from the “Service” dropdown. You should see data in the Incoming and Outgoing panels:
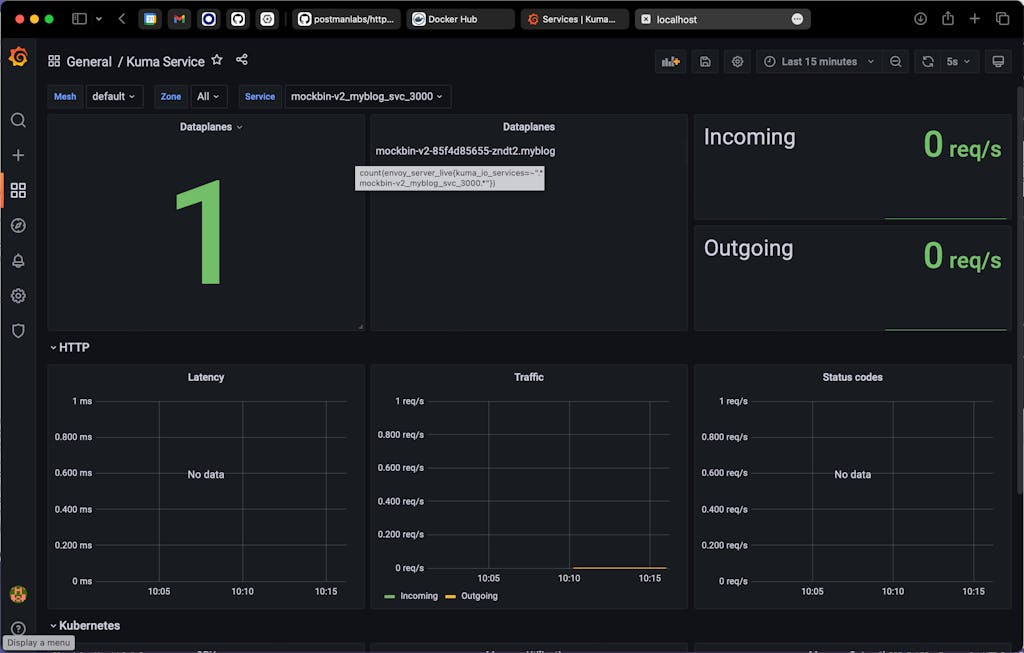
Next, let’s check version 2 of the mockbin service and make sure no traffic is flowing to that service. Select `mockbin-v2_myblog_svc_3000` from the “Service” dropdown:
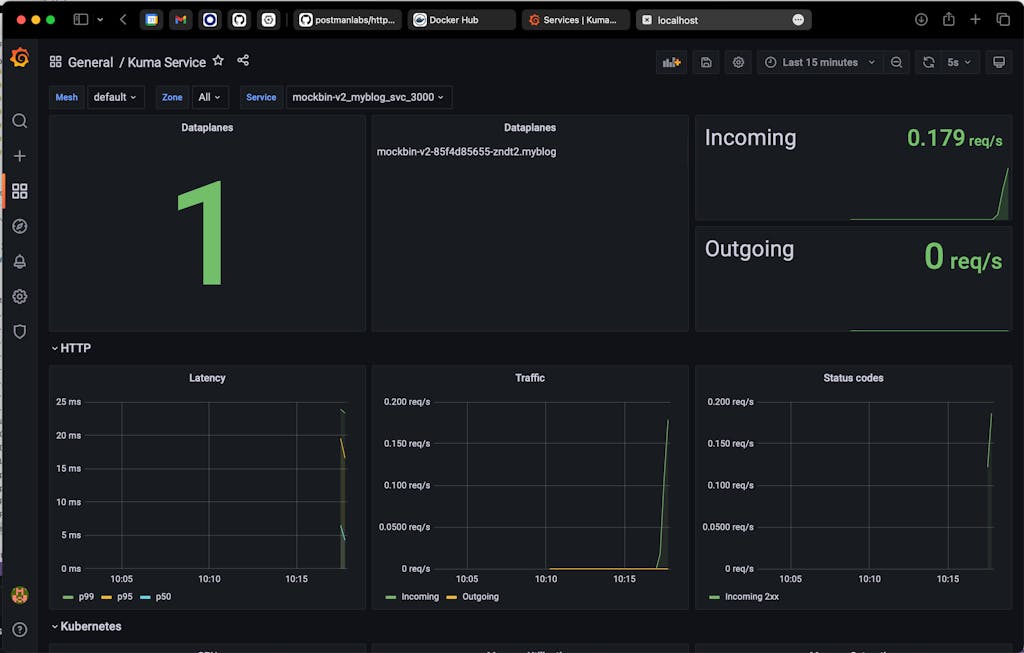
Now that we have determined no traffic is flowing to version 2, let’s mirror the traffic there:
Wait for a bit and you should start seeing inbound traffic flowing on the `mockbin-v2_myblog_svc_3000` service:
Let’s look at the Kuma policy we just applied. The Kuma policy we applied is of type “ProxyTemplate”. A ProxyTemplate allows custom policy to be applied directly to Envoy. This is a powerful feature in Kuma which allows the user to send Envoy configuration directly from Kuma. The below snippet says to apply the ProxyTemplate to the “mockbin_myblog_svc_3000” service.
Once Kuma finds the matches network filter, it applies the below value which will create a route in Envoy. The route defines a virtual host that sends traffic coming from domain “mockbin.myblog.svc.3000.mesh” with path “/requests” to the **local** Envoy “cluster”, i.e. localhost:3000. For more information on route matching in Envoy, see [here](https://www.envoyproxy.io/docs/envoy/latest/configuration/http/http_conn_man/route_matching)here.
In order to send traffic to version 2 of the mockbin service, we need to set an option on the Envoy route called “request_mirror_policies”. The request_mirror_policies option tells Envoy to send a configurable amount of traffic to the “mockbin-v2_myblog_svc_3000” cluster. In this example, we send 100% of the traffic. Envoy will not return the response from version 2 to the calling service which allows us to safely run development code in production:
The complete policy is located in the `traffic-mirror.yaml` file.
Now that we have production traffic flowing to a development version of the application, we can troubleshoot problems that are difficult to reproduce without production data.
Let’s see this in action. First, get the pod names:
blog-traffic-mirror % kubectl get po -n myblog
NAME                          READY   STATUS    RESTARTS   AGE
mockbin-588cfb4499-hlg6g      2/2     Running   0          13m
mockbin-v2-85f4d85655-zndt2   2/2     Running   0          13m
Let’s inspect the logs for version 1 of our mockbin service:
blog-traffic-mirror % kubectl logs mockbin-588cfb4499-hlg6g -n myblog -c mockbin
GET /requests 20011.614 ms - 861GET /requests 2002.040 ms - 861GET /requests 2001.552 ms - 870GET /requests 2001.218 ms - 861GET /requests 2001.597 ms - 870GET /requests 2001.071 ms - 861GET /requests 2000.989 ms - 870GET /requests 2001.174 ms - 861GET /requests 2001.201 ms - 870GET /requests 2001.227 ms - 861
Now, let’s inspect the logs for version 2 of our mockbin service. In version 2, we have inserted additional logging information, which in conjunction with production data, allows us to reproduce and identify the source of the problem:
blog-traffic-mirror % kubectl logs mockbin-v2-85f4d85655-zndt2 -n myblog -c mockbin
************ Hello from mockbin-traffic-mirror ************
GET /requests 2001.043 ms - 809************ Hello from mockbin-traffic-mirror ************
GET /requests 2001.252 ms - 800************ Hello from mockbin-traffic-mirror ************
GET /requests 2001.150 ms - 800************ Hello from mockbin-traffic-mirror ************
GET /requests 2001.464 ms - 809************ Hello from mockbin-traffic-mirror ************
GET /requests 2001.090 ms - 800************ Hello from mockbin-traffic-mirror ************
GET /requests 2001.626 ms - 800************ Hello from mockbin-traffic-mirror ************
GET /requests 2001.178 ms - 800************ Hello from mockbin-traffic-mirror ************
GET /requests 2001.368 ms - 800
Congratulations, you have successfully and safely mirrored production application traffic into a development version of the application to help you better debug and build production proof releases.
The more services you have running across different clouds and Kubernetes clusters, the harder it is to ensure that you have a central place to collect service mesh observability metrics. That's one of the reasons we created Kuma , an open source
Marco Palladino
# Kong Mesh 2.14: Finer Zone Proxy Control and Tighter Security
Kong Mesh 2.14 also introduces improvements to the mesh-scoped zone proxy deployment model. This makes it easier to configure and operate zone proxies for specific meshes, including Helm support for mesh zone proxy configuration. For customers runni
Justin Davies
# Stop Wasting Your Engineers’ Time and Start Improving Your System Stability with Kuma
At first glance, that does not make sense, right? The title suggests you should invest your DevOps/Platform team’s time in introducing a new product that most likely will:
increase the complexity of your platform
increase resource usage
in
Kuma is configurable through policies. These enable users to configure their service mesh with retries, timeouts, observability, and more.
Policies contain three main pieces of information:
Which proxies are being configured
What traffic for t
Introduction One of the most common questions I get asked is around the relationship between Kong Gateway and Kuma or Kong Mesh . The linking between these two sets of products is a huge part of the unique “magic” Kong brings to the connectivit
Kuma is an open source, CNCF service mesh that supports every environment, including Kubernetes and virtual machines. In this Kuma service mesh tutorial, I will show you how easy it is to get started. [iframe loading="lazy" width="890" height="56
Marco Palladino
# Observability for Your Kubernetes Microservices Using Kuma and Prometheus
A year ago, Harry Bagdi wrote an amazingly helpful blog post on observability for microservices. And by comparing titles, it becomes obvious that my blog post draws inspiration from his work. To be honest, that statement on drawing inspiration fro
Kevin Chen
## Ready to see Kong in action?
Get a personalized walkthrough of Kong's platform tailored to your architecture, use cases, and scale requirements.