## The 3 Pillars of Observability
Metrics, Logs, and Traces are often classified as the three pillars of observability. By connecting these three pillars, we could easily identify issues faster. We’ve done a lot of work to connect these three pillars to build a unified observability platform for Konnect using Datadog.
### Tag Everything
It all starts with tags.
All the Datadog agents running in our EKS clusters have default tags (like AWS region, environment name, etc.) added to every telemetry that it collects and ships to Datadog, whether it’s logs, metrics, traces, or events. This helps teams to navigate around the telemetry data that they access via Datadog UI or for building appropriate monitors around different production regions across geographical locations.
On top of the infra level tags, we add metadata tags. These include service mesh specific (from which logical mesh the telemetry came from) and workload specific (service metadata tags like service name, service version tags, etc.) to identify telemetry sources.
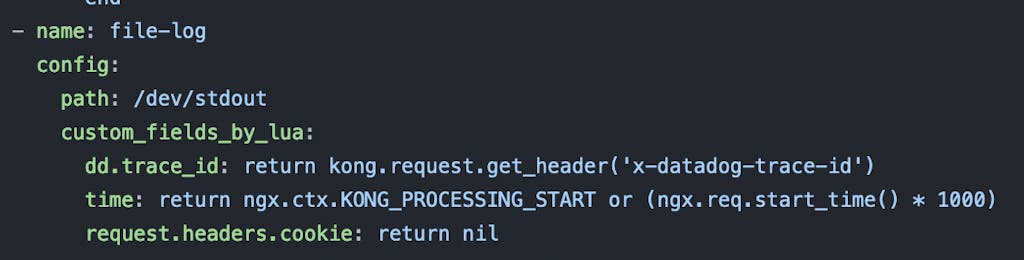
*Figure 2: How we add trace ID to the Kong Gateway access logs*
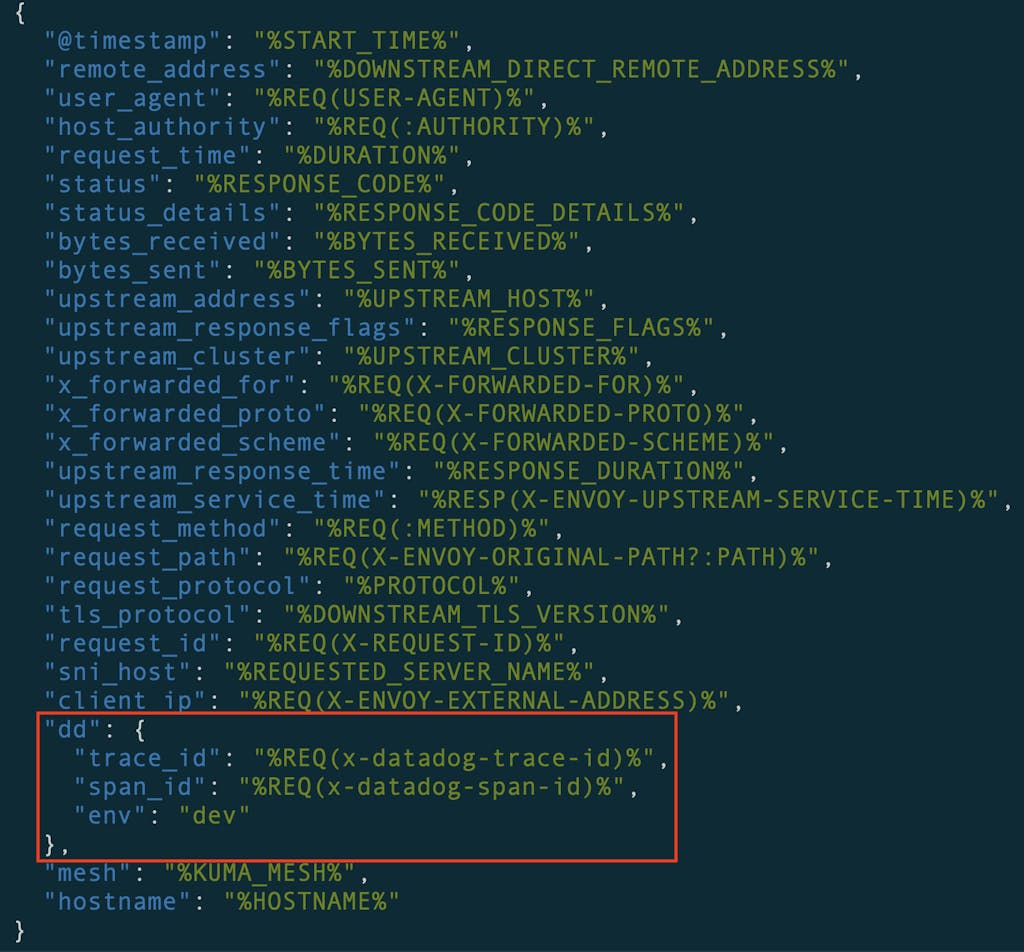
*Figure 3: How we add trace ID to Kong Mesh Dataplane access logs*
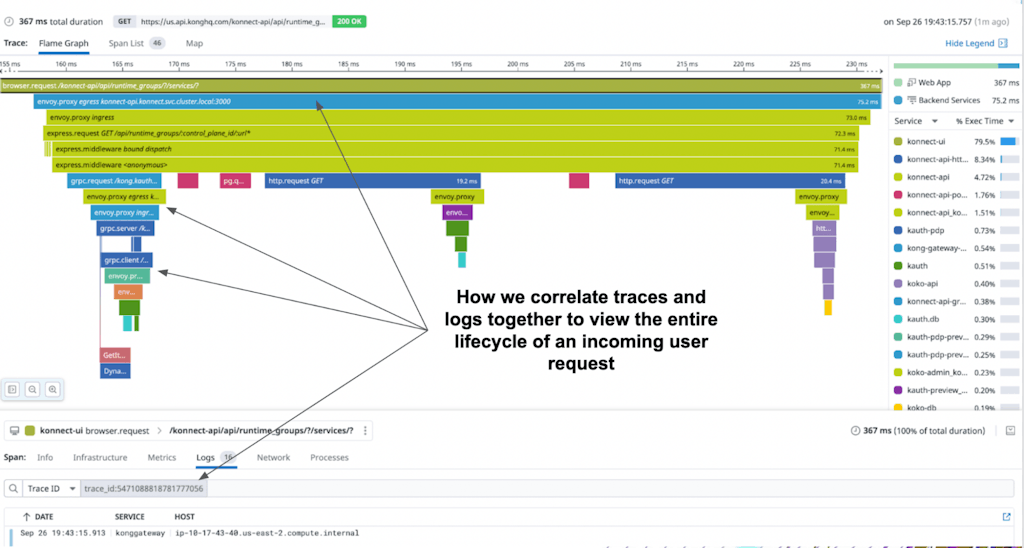
*Figure 4: How we correlate traces and logs together to view the entire lifecycle of an incoming user request*
### Metrics for better runtime visibility
In Konnect, we collect runtime metrics from every entity — whether its customer-facing LB/Kong Gateway, or service mesh, or our backend entities like our Aurora databases. We then use these metrics for a variety of use cases like (1) building overview dashboards to see how different components perform, (2) creating infra/service alerts, and (3) SLO dashboards for our weekly service reviews. All the metrics are ingested with necessary metadata tags as mentioned above.
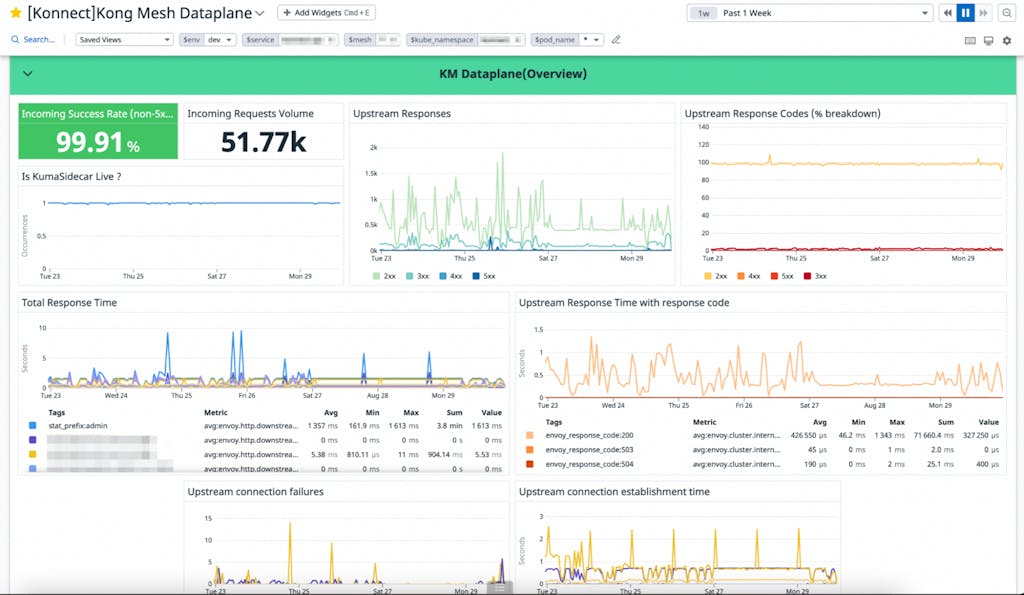
*Kong Mesh overview dashboard*
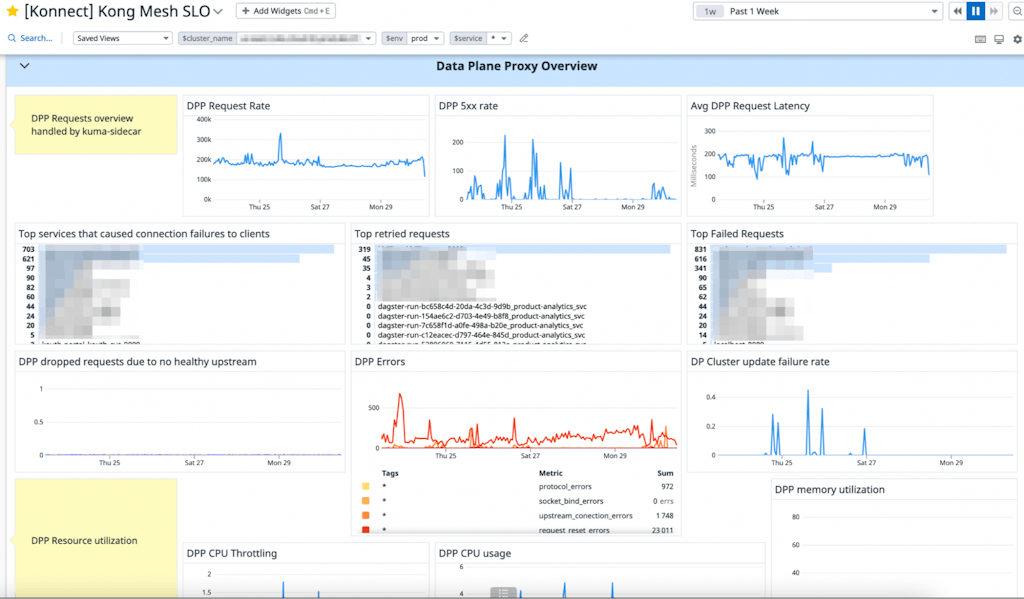
*Konnect Kong Mesh SLO dashboard*
### Tracing the traffic
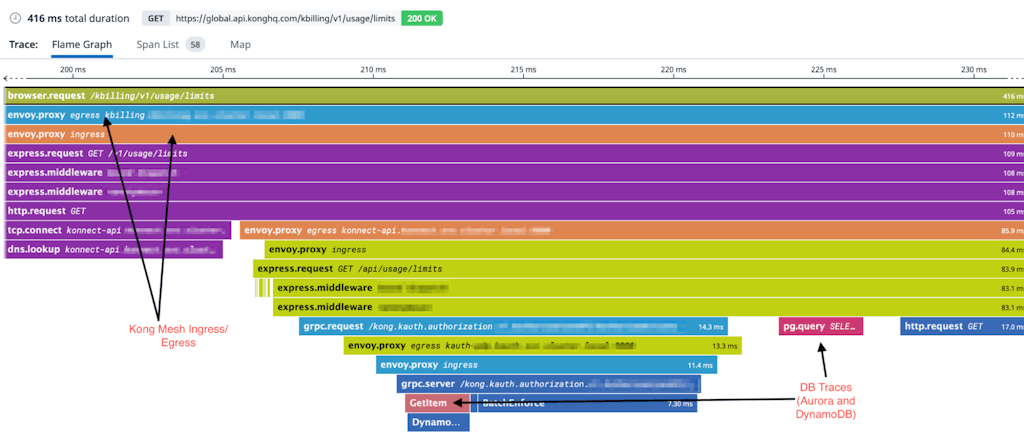
In Konnect, we use distributed tracing to view the entire lifecycle of a request. This helps us to find the bottlenecks.
We have tracing enabled on every layer of our infrastructure starting from the Kong Gateway all the way to our service mesh (which traces the east-west traffic) and from the services directly. Engineering and CRE teams are already leveraging the distributed trace to debug customer as well as internal connectivity issues which helps them to quickly identify issues and mitigate them.
### Conclusion
Building an end-to-end observability platform is a key requirement for every distributed infrastructure. It helps the teams to monitor, investigate, and capture issues faster before they cause widespread impact to customers. By connecting the three pillars of observability, we can make debugging issues faster (and fun).