# How to parse and forward API logs with Kong plugins
Robin Cher
Solutions Engineer (APAC), Kong
As more companies are undergoing digital transformation (resulting in a huge explosion of APIs and microservices), it's of paramount importance to get all the necessary data points and feedback to provide the best experience for both users and developers.
In this post, we'll explore how customers leverage Kong plugins and open technology to parse and forward their API logs of their cloud-managed service for further analysis.
### **Background**
Recently I worked with a customer who wanted to forward their API logs to Azure Log Analytics. This required some tinkering as there are no native solutions that will ship API logs to Azure Log Analytics directly.
### **Overview**
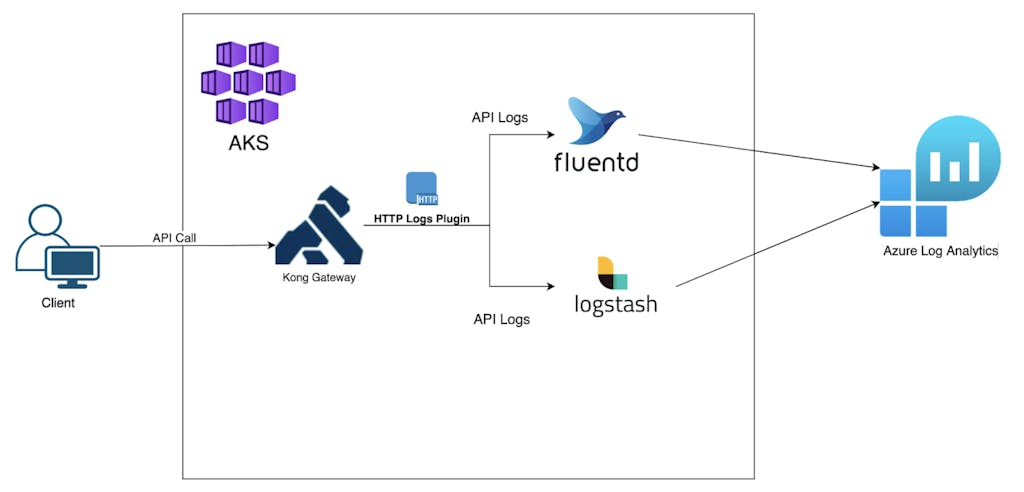
Kong is deployed in Azure Kubernetes Services, and for this experimentation, we'll try capturing API logs with HTTP Plugins and have them ingested by either Logstash or FluentD. To forward the logs to Azure Log Analytics, we need to install third party libraries for both Logstash and FluentD.
### **Technical Steps**
#### **Preparing the Plugins**
As both FluentD and Logstash do output directly to Azure Log Analytics, we need to enable third-party plugins that allow them to do so.
We'll also use Helm to set up both Logstash and FluentD in AKS.
**Logstash Helm Chart Configuration**
If you've yet to create a Log Analytics Workspace, do so now. Go to the workspace and select **Agent Management**. Retrieve the **Workspace ID** and **Primary/Secondary Key **and add into the configuration. For good security practice, consider mounting the config as a secret volume or ConfigMap.
image:"yourrepo/pre-bake-logstash-image"imageTag:"<<TAG>>"imagePullPolicy:"IfNotPresent"logstashConfig: logstash.yml: |
http.host:0.0.0.0 xpack.monitoring.enabled:false pipeline.ecs_compatibility: disabled
logstashPipeline: logstash.conf: |
# Input Plugin to take in log via HTTP
input { http { id => "kong-http-logs" host => "0.0.0.0" port => 8080}} # Output Plugin
output { azure_loganalytics { customer_id => "Log Analytics Workspace ID" shared_key => "Log Analytics Agent Primary or Secondary Key" log_type => "KongLogstashAPILog" key_names => [] key_types => {} max_batch_items => 50} # for debug
stdout { codec => rubydebug }}
# Open the port for HTTP Log ingestion from Kong
service: annotations:{} type: ClusterIP
ports: - name: http
port:8080 protocol: TCP
targetPort:8080
**FluentD Configuration**
Remember to include the additional plugin for Azure Log Analytics.
## Fluentd list of plugins to install
## Indicate the Azure Log Analytic Plugin here
plugins:- fluent-plugin-out-http
- fluent-plugin-azure-loganalytics
## Fluentd configurations:## Overwrite the output to Azure Log Analytics
fileConfigs: 01_sources.conf: |-
<source>
@id kong-api-http-logs
@type http
@log_level debug
@label @OUTPUT
port 9880 bind 0.0.0.0 body_size_limit 32m
keepalive_timeout 10s
tag azure-loganalytics.access
</source>
02_filters.conf: |-
03_dispatch.conf: |-
04_outputs.conf: |-
<label @OUTPUT>
<match **>
@id azure-loganalytics
@type azure-loganalytics
@log_level debug
customer_id <<Log Analytics Workspace Id>>
shared_key <<Log Analytics Agent Primary or Secondary Key>>
log_type KongFluentdAPILog
add_tag_field true </match>
</label>
## Expose the service to ingest log from Kong via HTTP
service: type:"ClusterIP" annotations:{} ports: - name:"http" protocol: TCP
containerPort:9880
Replace {**{Host}}** with your DNS or IP address where you accessed the Kong Admin API.
- Let's create a sample **Service** for Logstash
# Create a mockbin service for Logstash
curl -i -X POST \
 --url http://{HOST}:8001/services/ \
 --data 'name=mockbin-logstash-service' \
 --data 'url=http://mockbin.org'
2. Enable the plugin on the **Service**, and point to the internal hostname for Logstash which we just installed.
It should be in this example format **http://{{service-name}}.{{namespace}}.svc.cluster.local:8080 **
# Create a mockbin service for FluentD
curl -i -X POST \
 --url http://{HOST}:8001/services/ \
 --data 'name=mockbin-fluentd-service' \
 --data 'url=http://mockbin.org'
4. Enable the plugin on the service created above, and point to the internal hostname for fluentd.
Let's try generating some API logs by accessing the services. Before that, we need to create the corresponding **Routes** for both services.
# Create Routes for both services
curl -i -X POST \
 --url http://{HOST}:8001/services/mockbin-fluentd-service/routes \
 --data 'paths[]=/fluend'

curl -i -X POST \
 --url http://{HOST}:8001/services/mockbin-logstash-service/routes \
 --data 'paths[]=/logstash'
Generate some sample request to capture API Logs
# Generate Sample request for both routes
for ((i=1; i<=5; i++)); do
curl "http://{KONG_PROXY_HOST}/elastic"; done

for ((i=1; i<=5; i++)); do
curl "http://{KONG_PROXY_HOST}/fluentd"; done
**Azure Log Analytics**
Next we'll check if the Logs have been successfully lodged in Azure Log Analytics.
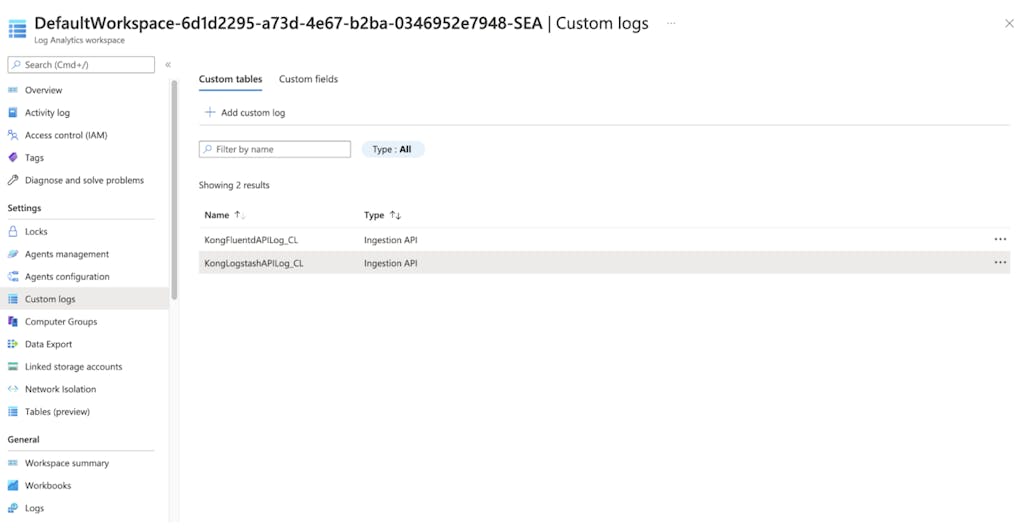
Go to Azure Portal, search for **Log Analytics Workspace**, and access the workspace that you created previously. Click on **Custom logs**, and you should see two Custom Tables that we configured in the logstash/fluentd configs.
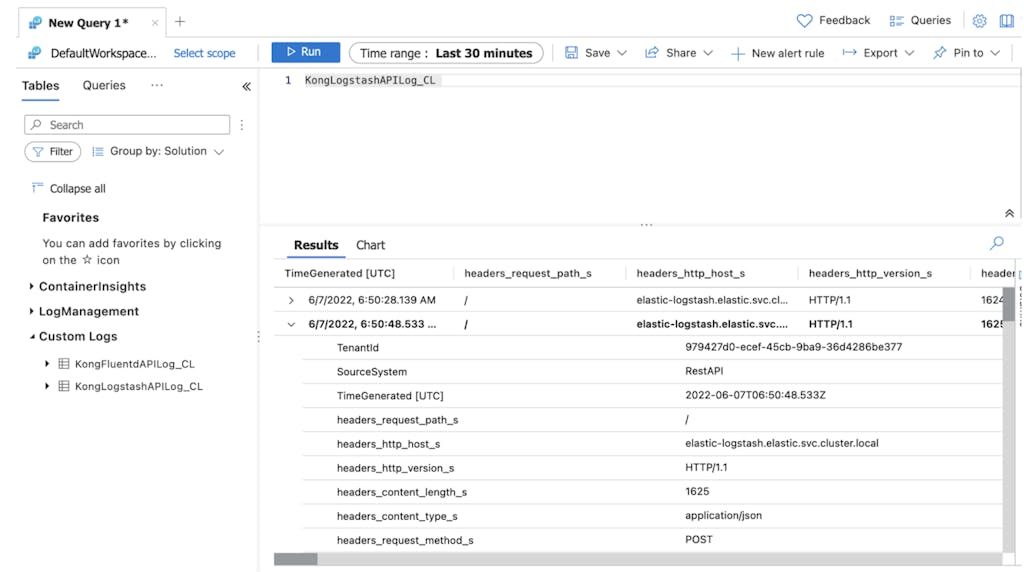
We can see API logs are being pipe to Azure Log Analytics by running some query.
**Logs forwarded by Logstash**
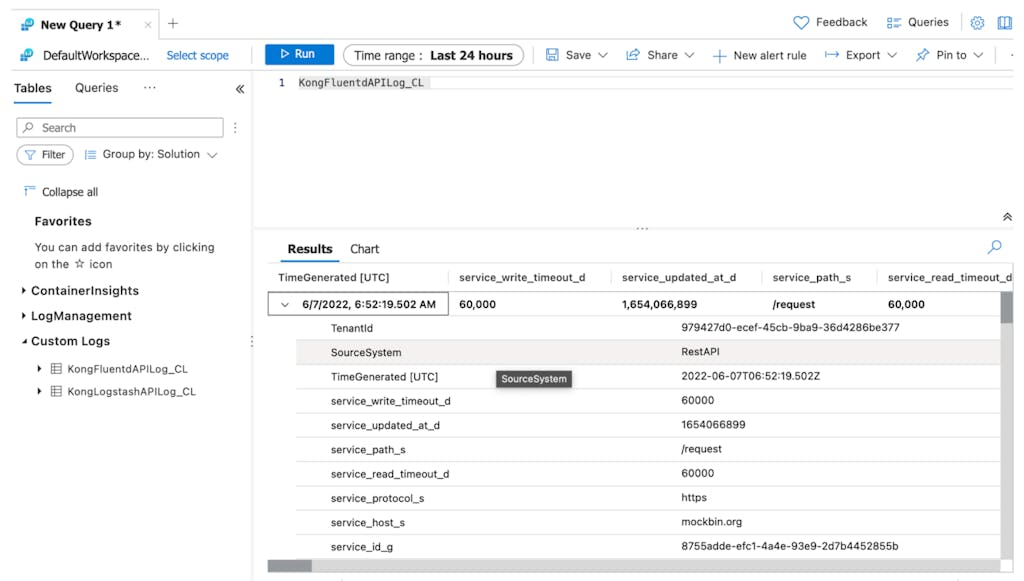
**Logs forwarded by Fluentd**
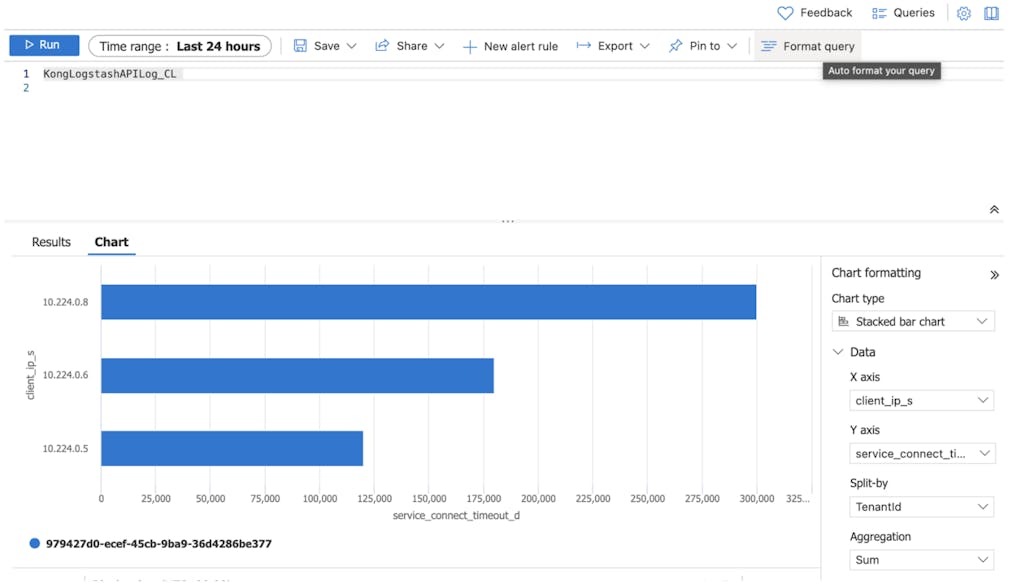
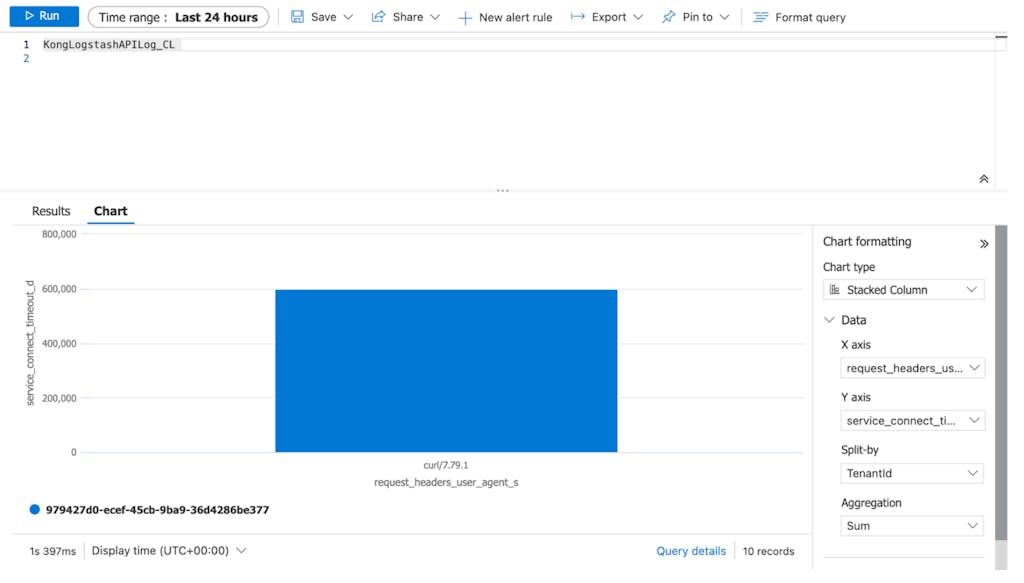
**Basic Charts **
We can configure some basic charts to analyze and observe the API logs.
### **Conclusion**
This experimentation was set up to address our customer's need to leverage on their existing Azure cloud service for API logging. As our customer undergoes their digital transformation by developing more microservices, possessing the capability to analyze how the services are behaving is essential for day-to-day operation.
We demonstrated how Kong is able to create a synergistic integration with other solutions due to its plug and play nature, and how seamless it can be when setting it up.
Kong's plugins make things simple by abstracting the integration complexity. With Kong’s ever-growing plugins ecosystem, it opened up more possibilities for our customers in creating even more value from their technology stack.
Understanding and monitoring the performance and health of applications and systems is critical. This is where observability comes into play. Observability is about gaining a comprehensive understanding of a system's internal state by analyzing the
Insomnia is a fast and lightweight open source desktop application that doubles as a tool for API design and testing and as an API client for making HTTP requests. It has built-in support for REST Client , gRPC and GraphQL . All of that is just
As part of the Kong Gateway 2.6 release, we shipped a brand new jq plugin for anyone with an enterprise license to use. It’s like we combined the request and response transformer plugins to form a single, more powerful plugin—supercharging the w
Event Hooks is a new Kong Enterprise feature launched in the Kong Gateway 2.5 Release . This feature sends you notifications when certain events happen on your Kong Gateway deployment. Kong Gateway listens for events, like routes, services, consum
Steve Young
# How to Test Gateway APIs Directly from Kong Konnect with Insomnia
What You'll Build
To explore the new integration, I'll build a realistic API platform workflow using Konnect, Kong Gateway, and Insomnia.
By the end of this tutorial, I'll have:
A Konnect Control Plane (KongAir Dev)
A local Kong Gateway Data Pl
Juhi Singh
# Connecting Kong and Solace: Building Smarter Event-Driven APIs
Running Kong in front of your Solace Broker adds real benefits: Authentication & Access Control – protect your broker from unauthorized publishers. Validation & Transformation – enforce schemas, sanitize data, and map REST calls into event topics.
Hugo Guerrero
# Insomnia 13: Native Kong Konnect Integration for Real-Time API Testing
Have you ever…. Copied an API spec out of Kong Konnect, or where you manage your APIs, pasted it into your API client, and immediately wondered if it’s the latest version? Sent an email to your platform team with the subject line “ which endpoint sh
Haley Giuliano
# Kong Konnect Observability and Analytics with Dynatrace
Understanding and monitoring the performance and health of applications and systems is critical. This is where observability comes into play. Observability is about gaining a comprehensive understanding of a system's internal state by analyzing the
Insomnia is a fast and lightweight open source desktop application that doubles as a tool for API design and testing and as an API client for making HTTP requests. It has built-in support for REST Client , gRPC and GraphQL . All of that is just
As part of the Kong Gateway 2.6 release, we shipped a brand new jq plugin for anyone with an enterprise license to use. It’s like we combined the request and response transformer plugins to form a single, more powerful plugin—supercharging the w
Event Hooks is a new Kong Enterprise feature launched in the Kong Gateway 2.5 Release . This feature sends you notifications when certain events happen on your Kong Gateway deployment. Kong Gateway listens for events, like routes, services, consum
Steve Young
# How to Test Gateway APIs Directly from Kong Konnect with Insomnia
What You'll Build
To explore the new integration, I'll build a realistic API platform workflow using Konnect, Kong Gateway, and Insomnia.
By the end of this tutorial, I'll have:
A Konnect Control Plane (KongAir Dev)
A local Kong Gateway Data Pl
Juhi Singh
# Connecting Kong and Solace: Building Smarter Event-Driven APIs
Running Kong in front of your Solace Broker adds real benefits: Authentication & Access Control – protect your broker from unauthorized publishers. Validation & Transformation – enforce schemas, sanitize data, and map REST calls into event topics.
Hugo Guerrero
# Insomnia 13: Native Kong Konnect Integration for Real-Time API Testing
Have you ever…. Copied an API spec out of Kong Konnect, or where you manage your APIs, pasted it into your API client, and immediately wondered if it’s the latest version? Sent an email to your platform team with the subject line “ which endpoint sh
Haley Giuliano
## Ready to see Kong in action?
Get a personalized walkthrough of Kong's platform tailored to your architecture, use cases, and scale requirements.