# Down the Rabbit Hole: Uncovering the Reasons Behind a Mysterious Performance Regression
Qiqi Zhang
### How does Kong Engineering approach Gateway performance benchmarks?
At Kong, we take the robustness and performance of our gateway product seriously, dedicating ourselves to maintaining high standards through a robust internal benchmark framework and infrastructure. Our setup includes a dedicated bare metal cluster for running performance tests, seamlessly integrated into our CI/CD process. Moreover, we conduct extensive performance testing for each major, minor, and patch release candidate. While this thorough approach aims to prevent significant performance regressions, we remain agile, ready to address and optimize potential regressions in performance as they arise in upcoming releases.
Below is a simplified overview of our benchmarking infrastructure:
Let's use the nightly benchmark as a case study to illustrate a segment of our benchmarking workflow.
In a recent release cycle, we detected a regression of approximately 10% in Requests Per Second (RPS) within the development branch. Initial quick benchmarks confirmed this regression. Furthermore, the performance regression can be reproduced even under the simplest configuration which suggests it is caused by changes in fundamental performance characteristics to our core proxy path.
Subsequently, we executed a series of rapid benchmarks, employing binary search on a range of commits to identify the problematic one. This led us to pinpoint the slow commit, which involved refactoring the algorithm for generating cache keys in the router.
Router matching represents one of the most resource-intensive operations within our core proxy path. To mitigate the computational costs associated with evaluating thousands of routes each time when a request comes in, we've implemented a caching mechanism. This allows us, in certain cases, to bypass the router-matching process entirely.
  local cache_key = (req_method  or "") .. "|" ..
                    (req_uri     or "") .. "|" ..
                    (req_host    or "") .. "|" ..
                    (sni         or "") .. "|" ..
                    (headers_key or "") .. "|" ..
                    (queries_key or "")
The previous algorithm consolidated all conditions into a single cache key. While accurate, this approach is not as efficient as it could be as not all customers utilize every condition simultaneously. Suppose the operator only configured routes that match against the incoming request path, the above caching algorithm will not be able to utilize cached results for requests that have the same path but different header values.
So in the 3.6 development cycle, we decided to refactor the algorithm to make it more efficient utilizing the knowledge of used fields from our new router, now it only uses the configured conditions to generate the cache key.
For instance, consider two routes configured by customers using the following expression:
Thanks to the new Rust-based router's awareness of all conditions utilized across routes, it achieves more efficient cache key generating and higher hit ratio in the router cache which (should) translate to higher RPS and less resource usage.
With the cache key rework commit identified and the rationale behind it understood, we then performed some profiling on this specific codepath.
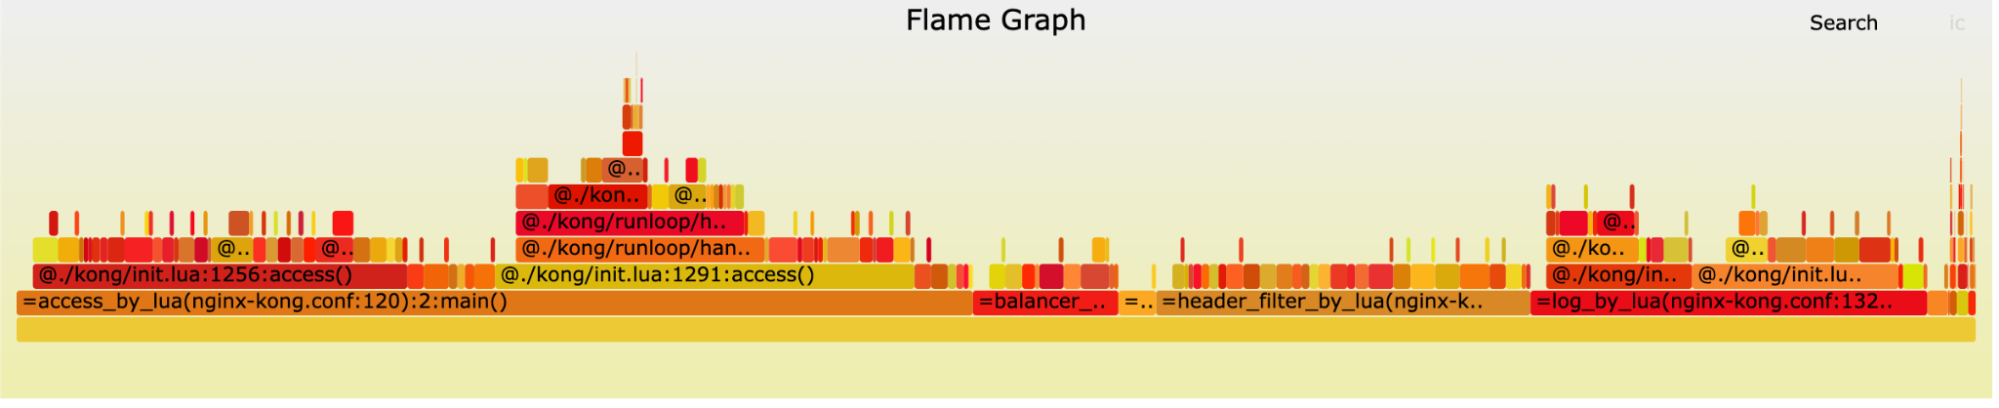
The timer-based flamegraph is generated by the handler of a repeatable timer, it collects stacktraces of code being executed at short intervals, and the result represents a probabilistic view into the percent of time LuaJIT spent on executing each codepath.
*Before the cache key algorithm rework*
*After the cache key algorithm rework*
We searched for the keyword 'route' and found no matching span in the first flamegraph, yet it accounted for 13.3% of the second graph (highlighted samples in the second graph).
### Instruction-based flamegraph
This flamegraph is produced through a counter mechanism. With each instruction executed by the LuaJIT interpreter, the counter increments by one. Once reaching a specified threshold, it captures the stack trace of the currently executing code. This method is instrumental in identifying code paths burdened by excessive instructions.
*Before the cache key algorithm rework*
*After the cache key algorithm rework*
We searched the keyword 'route,' yielding results akin to those from the time-based flamegraphs.
Having reaffirmed that the new cache key algorithm is indeed the reason behind the performance regression, yet finding no slow code upon a thorough review, we resolved to proceed with micro-benchmarking.
## Micro-benchmarking
We isolated the router code for direct invocation in our micro-benchmarks. The code, noted for its simplicity, is structured as follows:
for _i = 1, N do
  assert(router.match(request) is not false)
end
Surprisingly, our comparison revealed no noticeable performance difference between the old and new cache key algorithms.
## Going back to flamegraphs
It's puzzling — both timer-based and instruction-based flamegraphs indicate the router as a slow point, yet this isn't replicable in micro-benchmarking. Consequently, we went deeper into the flamegraphs to unearth more clues.
We searched for 'lru,' finding it accounted for 2.6% of CPU time but was associated with only 0.1% of instructions—specifically, LuaJIT bytecode. Typically, if a code path executes around 10% bytecode, it should consume approximately 10% of CPU time. While the number does not always match exactly due to different bytecodes having different costs, the discrepancy shouldn't be as vast.
Additionally, flamegraphs prior to the algorithm rework commit show no spans of 'lru,' despite a 100% cache hit rate, indicating it wasn't a significant performance factor before the change However, after the cache key algorithm refactor it suddenly started showing up in the profiling result. The LRU cache code has not seen any change for a long time, what could have caused this seemingly mysterious change in its performance?
## JIT debugging
### What is LuaJIT doing behind the scenes?
When dealing with complex dynamic language runtimes like LuaJIT, performance characteristics of the runtime are often affected by subtle codepath changes that are easily missed by human eyes. This is especially true with LuaJIT which performs a “high risk, high reward” JIT compilation of the bytecode at runtime to achieve faster execution for hot codepaths. Being able to JIT a codepath often results in many times of performance improvement while failing to do so can often lead to noticeable performance loss.
LuaJIT operates as a trace-based JIT (Just-In-Time) compiler, mapping the execution flow of bytecodes in real time. It creates a 'trace', a data structure encompassing both the sequence of bytecodes and their runtime context, and then compiles this trace into machine code.
This segment of code, situated in the critical execution path, is responsible for appending routable fields to the router to facilitate subsequent matching. The issue arises from generating a new closure for each request (the FNEW bytecode), a process that leads to a trace abort since LuaJIT is currently unable to compile this operation yet.
### What is the trace abort?
A trace abort occurs when LuaJIT encounters a scenario it cannot, or chooses not to, compile, resulting in the decision to halt the trace and refrain from compiling that particular execution flow.
For example, LuaJIT can not JIT compile the standard function `error`. This makes sense, this function is used for raising a Lua error (which is similar to the concept exception in languages like C++/Java and should not be in the hot path). Implementing JIT compilation on it would result in little performance benefit.
Here is an example list that shows a few functions LuaJIT cannot or chooses not to compile:
`debug.*` — Never compile
`getfenv` — Only compile `getfenv(0)`
`string.dump` — Never compile
### How does the trace abort affect performance?
LuaJIT bytecode flow tracing and JIT compilation incur more overhead in addition to the cost of interpreter execution, therefore, it is only triggered when a hot code path has been identified at runtime. In the event of a trace abort, the trace workflow will be terminated immediately until the next hotspot is found. Consequently, this may sometimes affect the opportunity to compile subsequent code segments and cause them to run in the slower interpreted mode as well.
## Fixing and result
Resolving this issue is straightforward: replacing the closure with a local function eliminates the need to generate it for every request.
local function foo() ... end
...
fields_visitor(fields, params, nil, foo)
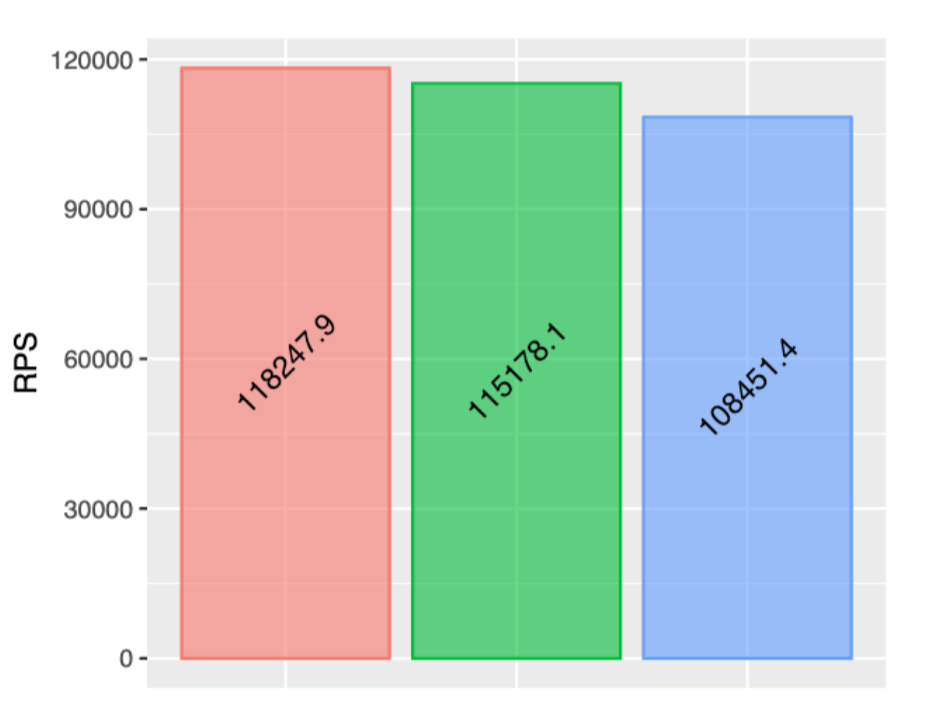
We subsequently conducted another performance comparison involving three versions:
*From left to right, the previous release, the version with the fix, and the upcoming release candidate (RC).*
Currently, we observe only a 2.6% regression in RPS, which falls within the margin of error of our performance measurement. Fortunately, enhancements in the router cache hit rate promise additional performance gains for our customers. The conclusive benchmark confirms the absence of significant regression in RPS.
## More findings
Since NYI has such a significant impact on performance, so we did more profiling after the release and found a few NYIs on the hot path, a quick benchmark produced another 7% in RPS improvements.
## What’s next?
The LuaJIT is highly complex, making it difficult to expect every engineer to understand its implementation details. Therefore, we plan to enhance the debuggability of LuaJIT by providing sketches of key performance indicators such as the occurrence of NYIs in the hot path and trace aborts. This will help us detect any code that is not compatible with JIT compilation. Subsequently, we aim to incorporate this monitoring into our internal CI/CD workflow, enabling us to identify and address these issues at an early stage. All of these work together to achieve one goal — to provide a robust and performance platform that our customers can rely on.
What You'll Build
To explore the new integration, I'll build a realistic API platform workflow using Konnect, Kong Gateway, and Insomnia.
By the end of this tutorial, I'll have:
A Konnect Control Plane (KongAir Dev)
A local Kong Gateway Data Pl
Juhi Singh
# How We Used Agentic AI to Fix Kong Gateway's Flakiest Tests
Quality is at the core of every product we build. To move fast without compromising on quality, we rely on an extensive set of test suites that tell us quickly whether a change has caused a regression. Those suites are large enough that a single ful
Datong Sun
# Automating Agreement Workflows with Kong Konnect and Docusign for Developers
Traditional agreement processes were slow and heavily manual. Documents were often created in office tools, shared through email, printed, signed physically, and stored across multiple systems. Tracking the status of agreements required manual follo
Paige Rossi
# Beyond Static Routing: Modernizing API Logic with Conditional Policy Execution
Imagine you have a single Service, order-api . You want to apply a strict rate limit to most traffic, but you want to bypass that limit—or apply a different one—if the request contains a specific X-App-Priority: High header. Previously, you had t
How OAuth 2.0 Token Exchange Reshapes Trust Between Services — and Why the API Gateway Is Exactly the Right Place to Enforce It
Modern applications don’t run as a single monolithic. They are composed of services — frontend APIs, backend microservi
Veena Rajarathna
# No More Static Secrets: Kong Expands Cloud-Native Authentication Support
How Kong Gateway 3.14 closes the consistency gap in IAM-based authentication across AWS, Azure and GCP — and what it means for your production deployments
Starting with 3.13 (which addressed Redis support) and completed in 3.14, Kong now presents
Walker Zhao
# Practical Strategies to Monetize AI APIs in Production
Traditional APIs are, in a word, predictable. You know what you're getting: Compute costs that don't surprise you Traffic patterns that behave themselves Clean, well-defined request and response cycles AI APIs, especially anything that runs on LLMs
Deepanshu Pandey
# How to Test Gateway APIs Directly from Kong Konnect with Insomnia
What You'll Build
To explore the new integration, I'll build a realistic API platform workflow using Konnect, Kong Gateway, and Insomnia.
By the end of this tutorial, I'll have:
A Konnect Control Plane (KongAir Dev)
A local Kong Gateway Data Pl
Juhi Singh
# How We Used Agentic AI to Fix Kong Gateway's Flakiest Tests
Quality is at the core of every product we build. To move fast without compromising on quality, we rely on an extensive set of test suites that tell us quickly whether a change has caused a regression. Those suites are large enough that a single ful
Datong Sun
# Automating Agreement Workflows with Kong Konnect and Docusign for Developers
Traditional agreement processes were slow and heavily manual. Documents were often created in office tools, shared through email, printed, signed physically, and stored across multiple systems. Tracking the status of agreements required manual follo
Paige Rossi
# Beyond Static Routing: Modernizing API Logic with Conditional Policy Execution
Imagine you have a single Service, order-api . You want to apply a strict rate limit to most traffic, but you want to bypass that limit—or apply a different one—if the request contains a specific X-App-Priority: High header. Previously, you had t
How OAuth 2.0 Token Exchange Reshapes Trust Between Services — and Why the API Gateway Is Exactly the Right Place to Enforce It
Modern applications don’t run as a single monolithic. They are composed of services — frontend APIs, backend microservi
Veena Rajarathna
# No More Static Secrets: Kong Expands Cloud-Native Authentication Support
How Kong Gateway 3.14 closes the consistency gap in IAM-based authentication across AWS, Azure and GCP — and what it means for your production deployments
Starting with 3.13 (which addressed Redis support) and completed in 3.14, Kong now presents
Walker Zhao
# Practical Strategies to Monetize AI APIs in Production
Traditional APIs are, in a word, predictable. You know what you're getting: Compute costs that don't surprise you Traffic patterns that behave themselves Clean, well-defined request and response cycles AI APIs, especially anything that runs on LLMs
Deepanshu Pandey
## Ready to see Kong in action?
Get a personalized walkthrough of Kong's platform tailored to your architecture, use cases, and scale requirements.