# Observability for Your Kubernetes Microservices Using Kuma and Prometheus
Kevin Chen
A year ago, Harry Bagdi wrote an [amazingly helpful blog post](https://konghq.com/blog/observability-kubernetes-kong)amazingly helpful blog post on observability for microservices. And by comparing titles, it becomes obvious that my blog post draws inspiration from his work. To be honest, that statement on drawing inspiration from Harry extends well beyond this one blog post - but enough about that magnificent man and more on why I chose to revisit his blog.
When he published it, our company was doing an amazing job at one thing: API gateways. So naturally, the blog post only featured leveraging the Prometheus monitoring stack in conjunction with Kong Gateway. But to quote Bob Dylan, "the times they are a-changin [and sometimes an API gateway is just not enough]". So, we released Kuma, an open source service mesh to work in conjunction with Kong Gateway. How does this change observability for the microservices in our Kubernetes cluster? Well, let me show you.
Once the prerequisite cluster is set up, getting Prometheus monitoring stack setup is a breeze. Just run the following `kumactl install [..]` command and it will deploy the stack. This is the same `kumactl` binary we used in the prerequisite step. However, if you do not have it set up, you can download it on [Kuma's installation page](https://kuma.io/install/latest)Kuma's installation page.
$ kumactl install metrics | kubectl apply -f -

namespace/kuma-metrics created
podsecuritypolicy.policy/grafana created
configmap/grafana created
configmap/prometheus-alertmanager created
configmap/provisioning-datasource created
configmap/provisioning-dashboards created
configmap/prometheus-server created
persistentvolumeclaim/prometheus-alertmanager created
persistentvolumeclaim/prometheus-server created
...
To check if everything has been deployed, check the `kuma-metrics` namespace:
Once the pods are all up and running, we need to edit the Kuma mesh object to include the `metrics: prometheus` section you see below. It is not included by default, so you can edit the mesh object using `kubectl` like so:
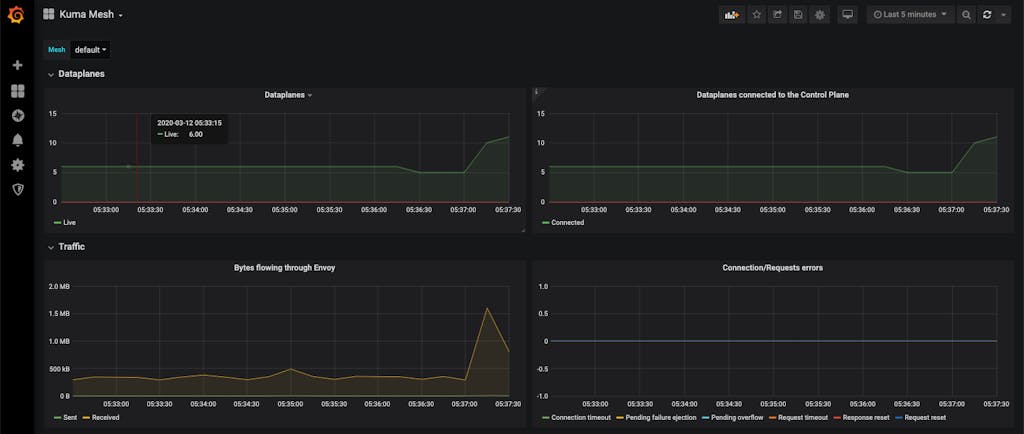
We can visualize our metrics with Kuma's prebuilt Grafana dashboards. And the best part is that Grafana was also installed alongside the Prometheus stack, so if you port-forward the Grafana server pod in `kuma-metrics` namespace, you will see all your metrics:
$ kubectl port-forward grafana-c987548d6-5l7h7 -n kuma-metrics 3000Forwarding from 127.0.0.1:3000 -> 3000Forwarding from [::1]:3000 -> 3000
- Kuma Mesh: High level overview of the entire service mesh
- Kuma Dataplane: In-depth metrics on a particular Envoy dataplane
- Kuma Service to Service: Metrics on connection/traffic between two services
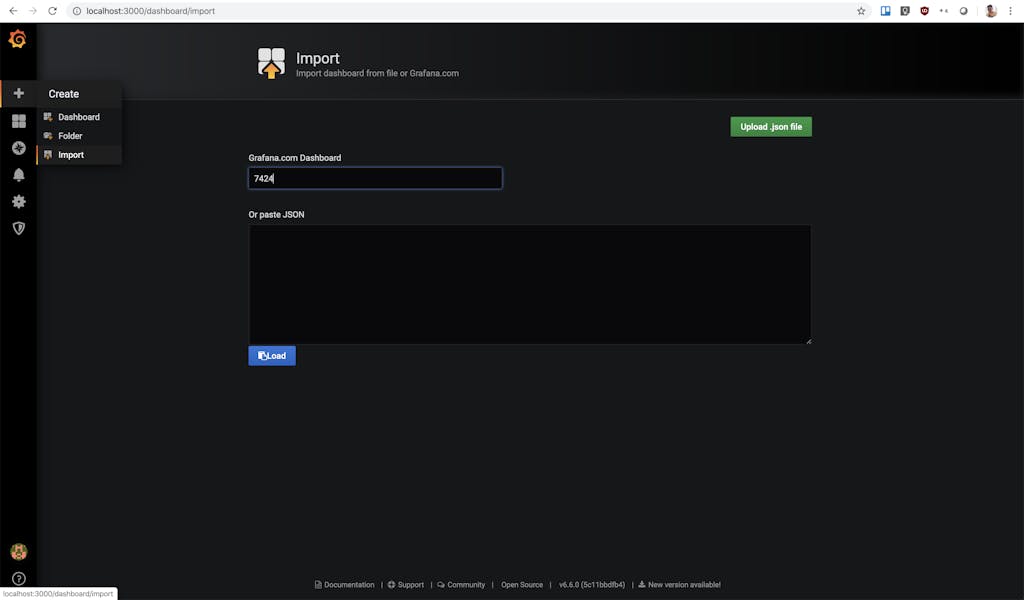
But we can do better…by stealing more ideas from Harry's blog. In the remainder of this tutorial, I will explain how you can extend the Prometheus monitoring stack we just deployed to work in conjunction with Kong.
On this page, you will enter the Kong Grafana dashboard ID `7424` into the top field. The page will automatically redirect you to the screenshot page below if you entered the ID correctly:
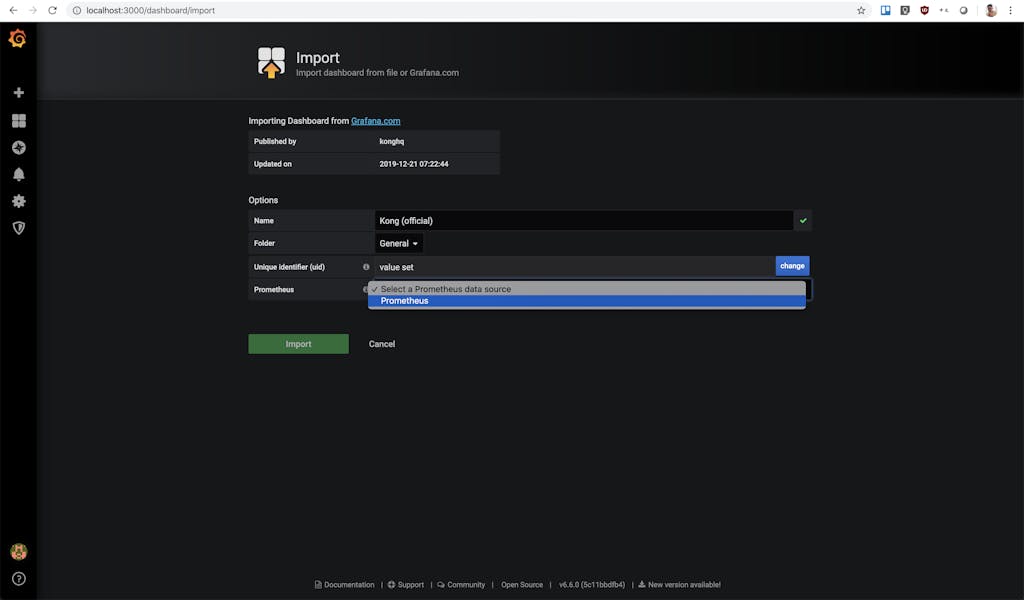
Here, you need to select the Prometheus data source. The drop down should only have one option named "Prometheus," so be sure to just select that. Click the green "Import" button when you are done. But before we go explore that new dashboard we created, we need to set up the [Prometheus plugin](https://docs.konghq.com/hub/kong-inc/prometheus)Prometheus plugin on the Kong API gateway.
## **Enabling Prometheus Plugins on Kong Ingress Controller**
We need the Prometheus plugin to expose metrics related to Kong and proxied upstream services in Prometheus exposition format. But you may ask, "wait, didn't we just set up Prometheus by enabling the metrics option on the entire Kuma mesh? And if Kong sits within this mesh, why do we need an additional Prometheus plugin?" I know it may seem redundant, but let me explain. When enabling the metrics option on the mesh, Prometheus only has access to metrics exposed by the [data planes](https://kuma.io/docs/0.4.0/documentation/dps-and-data-model/#dataplane-entity)data planes ([Envoy sidecar proxies](https://kuma.io/docs/0.4.0/documentation/dps-and-data-model/#envoy)Envoy sidecar proxies) that sit alongside the services in the mesh, not from the actual services. So, Kong Gateway has a lot more metrics available that we can gain insight into if we can reuse the same Prometheus server.
Export the PROXY_IP once again since we'll be using it to generate some consistent traffic.
export PROXY_IP=$(minikube service -p kuma-demo -n kuma-demo kong-proxy --url | head -1)
This will be the same PROXY_IP step we used in the prerequisite blog post. If nothing shows up when you `echo $PROXY_IP`, you will need to revisit the prerequisite and make sure Kong is set up correctly within your mesh. But if you can access the application via the PROXY_IP, run this loop to throw traffic into our mesh:
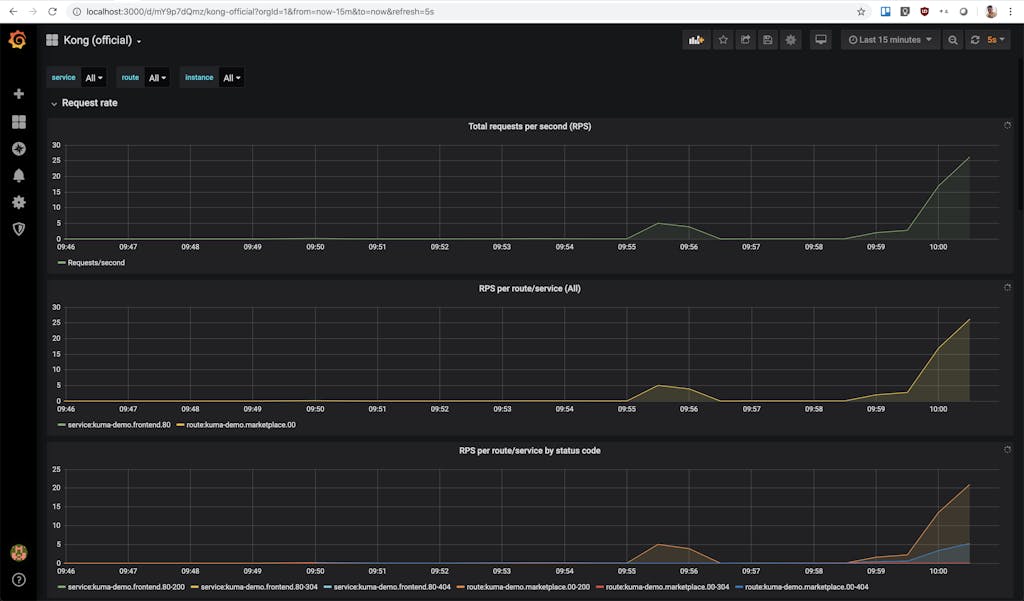
Hell! It’s a family motto. Say it with me, Jerry Harry. SHOW. ME. THE. METRICS. Go back to the Kong Grafana dashboard and watch those sweet metrics trickle in:
We're very excited to announce Kong Mesh 2.12 to the world! Kong Mesh 2.12 delivers two very important features: SPIFFE / SPIRE support, which provides enterprise-class workload identity and trust models for your mesh, as well as a consistent Kuma R
Justin Davies
# Kong Mesh 2.14: Finer Zone Proxy Control and Tighter Security
Kong Mesh 2.14 also introduces improvements to the mesh-scoped zone proxy deployment model. This makes it easier to configure and operate zone proxies for specific meshes, including Helm support for mesh zone proxy configuration. For customers runni
Justin Davies
# Debugging Applications in Production with Service Mesh
As an application developer, have you ever had to troubleshoot an issue that only happens in production? Bugs can occur when your application gets released into the wild, and they can be extremely difficult to debug when you cannot reproduce without
Damon Sorrentino
# Getting Started With Kong Istio Gateway on Kubernetes With Kiali for Observability
Have you ever found yourself in a situation where all your service mesh services are running in Kubernetes, and now you need to expose them to the outside world securely and reliably? Ingress management is essential for your configuration and ope
The more services you have running across different clouds and Kubernetes clusters, the harder it is to ensure that you have a central place to collect service mesh observability metrics. That's one of the reasons we created Kuma , an open source
Marco Palladino
# Observability For Your Microservices Using Kong and Kubernetes
Read the latest version: APM With Prometheus and Grafana on Kubernetes Ingress Archived post below. In the modern SaaS world, observability is key to running software reliability, managing risks and deriving business value out of the code that you'
Harry Bagdi
# A Unified Gateway for APIs + Agentic Applications on VMware VKS with Kong Konnect
Built on top of Kong API Gateway, the Kong AI Gateway is designed to address key challenges in enterprise AI adoption. Modern AI applications rarely rely on a single model; instead, they orchestrate multiple GenAI providers, agent frameworks, Age
Anika Suri
# Kong Mesh 2.12: SPIFFE/SPIRE Support and Consistent XDS Resource Names
We're very excited to announce Kong Mesh 2.12 to the world! Kong Mesh 2.12 delivers two very important features: SPIFFE / SPIRE support, which provides enterprise-class workload identity and trust models for your mesh, as well as a consistent Kuma R
Justin Davies
# Kong Mesh 2.14: Finer Zone Proxy Control and Tighter Security
Kong Mesh 2.14 also introduces improvements to the mesh-scoped zone proxy deployment model. This makes it easier to configure and operate zone proxies for specific meshes, including Helm support for mesh zone proxy configuration. For customers runni
Justin Davies
# Debugging Applications in Production with Service Mesh
As an application developer, have you ever had to troubleshoot an issue that only happens in production? Bugs can occur when your application gets released into the wild, and they can be extremely difficult to debug when you cannot reproduce without
Damon Sorrentino
# Getting Started With Kong Istio Gateway on Kubernetes With Kiali for Observability
Have you ever found yourself in a situation where all your service mesh services are running in Kubernetes, and now you need to expose them to the outside world securely and reliably? Ingress management is essential for your configuration and ope
The more services you have running across different clouds and Kubernetes clusters, the harder it is to ensure that you have a central place to collect service mesh observability metrics. That's one of the reasons we created Kuma , an open source
Marco Palladino
# Observability For Your Microservices Using Kong and Kubernetes
Read the latest version: APM With Prometheus and Grafana on Kubernetes Ingress Archived post below. In the modern SaaS world, observability is key to running software reliability, managing risks and deriving business value out of the code that you'
Harry Bagdi
# A Unified Gateway for APIs + Agentic Applications on VMware VKS with Kong Konnect
Built on top of Kong API Gateway, the Kong AI Gateway is designed to address key challenges in enterprise AI adoption. Modern AI applications rarely rely on a single model; instead, they orchestrate multiple GenAI providers, agent frameworks, Age
Anika Suri
## Ready to see Kong in action?
Get a personalized walkthrough of Kong's platform tailored to your architecture, use cases, and scale requirements.