# Implementing OpenTelemetry Observability with Kong Konnect & Dynatrace
Claudio Acquaviva
Principal Architect, Kong
Observability has become critical to ensuring the effective monitoring of application and system performance and health. It focuses on understanding a system’s internal state by analyzing the data it produces in the context of real-time events and actions across the infrastructure. Unlike traditional monitoring, which mainly notifies you when issues arise, observability offers the tools and insights needed to determine not only that a problem exists but also its root cause. This enables teams to take a proactive approach to optimizing and managing systems, rather than simply responding to failures.
To achieve this, observability focuses on three core pillars:
- Logs: Detailed, timestamped records of events and activities within a system, offering a granular view of operations
- Metrics: Quantitative data points that capture various aspects of system performance, such as resource usage, response times, and throughput
- Traces: Visual paths that requests follow as they traverse through different system components, enabling end-to-end analysis of transactions and interactions
Implementing observability at the API gateway layer is crucial. As the API gateway serves as a central point for managing and routing traffic across distributed services, applying observability to it brings an enterprise-wide perspective on how applications are consumed. Here are some important benefits it can bring:
- Observability at the API gateway layer allows you to track request patterns, response times, and error rates across all applications.
- It enables faster problem identification, such as high latencies, unexpected error rates, or traffic spikes, before they are routed to other services.
- It provides a first line of defense for troubleshooting and mitigation monitoring and logging suspicious activity, failed authentication attempts, or potential attacks.
- Since API gateways route requests to multiple applications, observability can help map dependencies between services, offering insights into how they interact, such as failures and bottlenecks.
- The API gateway can start and maintain distributed tracing across multiple applications by injecting trace IDs into all requests.
- Last but not least, observability at the API gateway layer provides important business metrics like: most accessed APIs, usage patterns by different clients or regions, API performance trends over time, monitor and report on service-level agreements (SLAs) and compliance metrics effectively
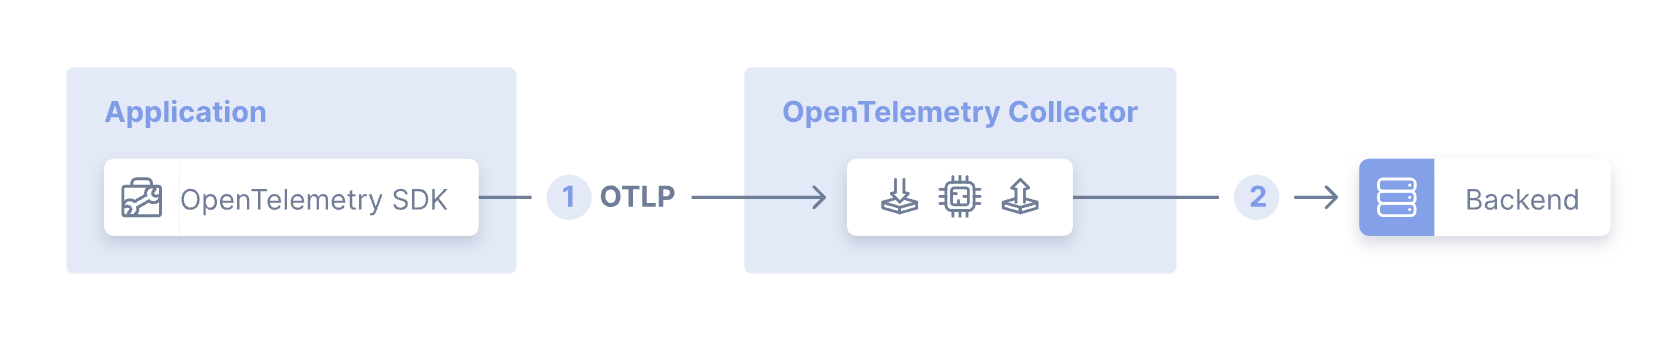
“OpenTelemetry, also known as OTel, is a vendor-neutral open source Observability framework for instrumenting, generating, collecting, and exporting telemetry data such as traces, metrics, and logs.”
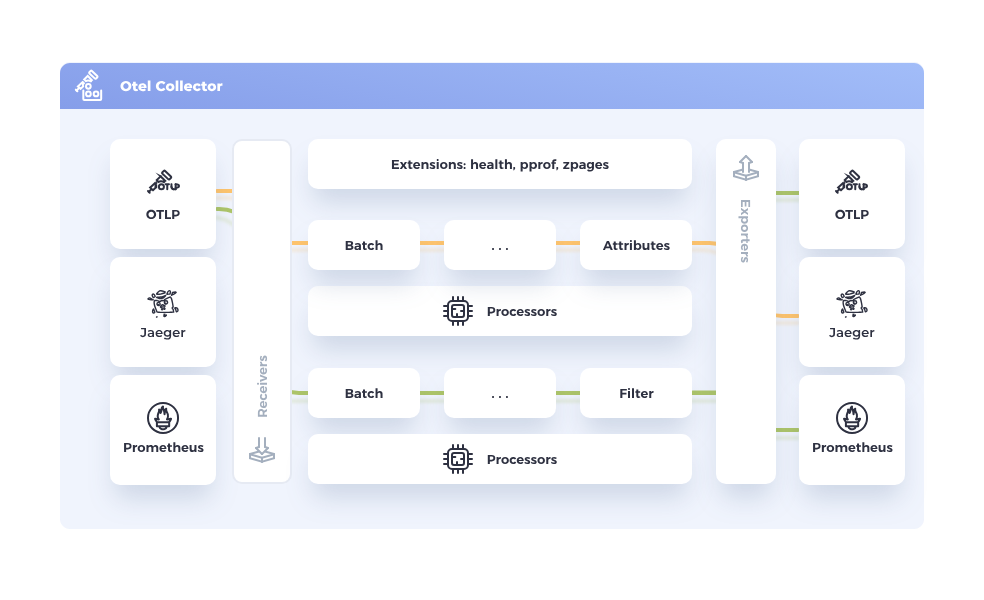
Although it's totally valid to send telemetry signals directly from the application to the observability backends with [no collector](https://opentelemetry.io/docs/collector/deployment/no-collector/)no collector in place, it's generally recommended to use the OTel Collector. The collector abstracts the backend observability infrastructure, so the services can normalize this kind of processing more quickly in a standardized manner as well as let the collector take care of error handling, encryption, data filtering, transformation, etc.
As you can see in the diagram, the collector defines multiple components such as:
## Kong Konnect and Dynatrace reference architecture
The Kong Konnect and Dynatrace topology is quite simple in this example:
The main components here are:
- **Konnect Control Plane**: responsible for administration tasks including APIs and Policies definition
- **Konnect Data Plane**: handles the requests sent by the API consumers
- **Kong Gateway Plugins**: components running inside the Data Plane to produce OpenTelemetry signals
- **Upstream Service**: services or microservices protected by the Konnnect Data Plane
- **OpenTelemetry Collector**: handles and processes the signals sent by the OTel plugin and sends them to the Dynatrace tenant
- **Dynatrace Platform**: provides a single pane of glass with dashboards, reports, etc.
## Simple e-commerce application
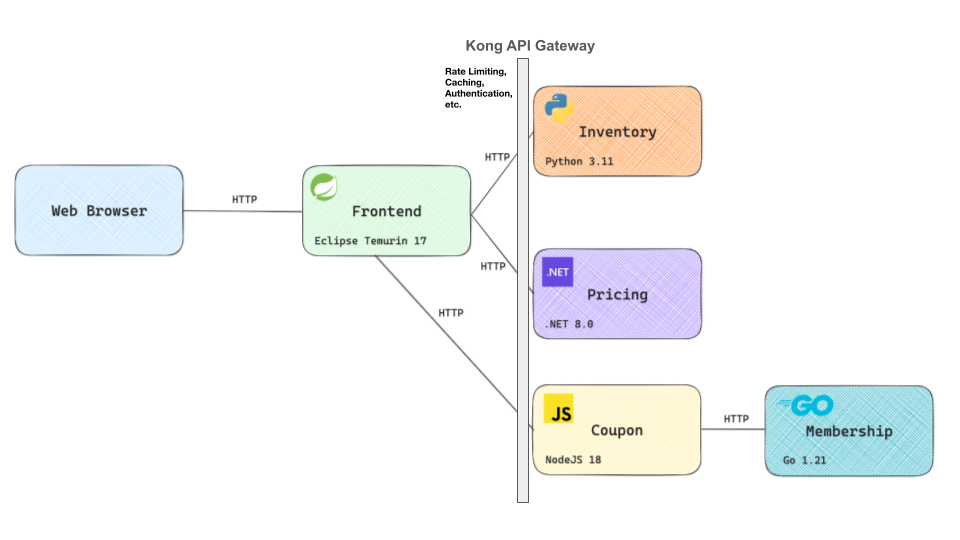
To demonstrate Kong and Dynatrace working together in a more realistic scenario, we're going to take a simple e-commerce application and get it protected by Kong and monitored by Dynatrace. The [application](https://github.com/odigos-io/simple-demo)application is available publicly and here's a diagram with a high-level architecture of the application with its microservices:
Logically speaking, we can separate the microservices into two main layers:
- Backend with Inventory, Pricing, Coupon, and Membership microservices.
- Frontend, responsible for sending requests to the Backend Services
As we mentioned earlier, one of the main goals of an API gateway is to abstract services and microservices from the frontend perspective so we can take advantage of all its capabilities, including policies, protocol abstraction, etc.
In this sense, all incoming requests coming from the frontend microservices are processed by Kong Gateway and routed accordingly to the microservices sitting behind it.
### Application instrumentation
One of the Kong Gateway's responsibilities is to generate and provide all signals to Dynatrace. This is done by the Kong Gateway Plugins, which can be configured accordingly. For example, from the tracing perspective, the Kong OpenTelemetry Plugin starts all traces. The Kong Prometheus Plugin is responsible for producing Prometheus-based metrics as the Kong TCP Log Plugin transmits the Kong Gateway access logs to Dynatrace.
Our Konnect Data Plane, with all Kong Gateway Plugins, alongside the OTel Collector will be running on an Amazon EKS cluster. So, let's create it using [eksctl](https://eksctl.io/)eksctl, the official CLI for Amazon EKS, like this:
Any Konnect subscription has a "default" Control Plane defined. Click on it and, inside its landing page, click on “Create a New Data Plane Node”.
Choose Kubernetes as your platform. Click on "Generate certificate", copy and save the Digital Certificate and Private Key as `tls.crt` and `tls.key` files as described in the instructions. Also copy and save the configuration parameters in a `values.yaml` file.
The main comments here are:]
- Replace the cluster_* endpoints and server names with yours.
- The “tracing_instrumentations: all” and “tracing_sampling_rate: 1.0” parameters are needed for the Kong Gateway OpenTelemetry plugin we are going to describe later.
- The Kong Data Plane is going to be consumed exclusively by the Frontend microservice, therefore it can be deployed as “type: ClusterIP”.
The OpenTelemetry Operator requires [Cert-Manager](https://cert-manager.io/)Cert-Manager to be installed in your Kubernetes cluster. The Cert-Manager can then issue certificates to be used by the communication between the Kubernetes API Server and the existing webhook included in the operator.
As you may recall, one of the microservices of the e-Commerce application is written in [Go Programming Language](https://go.dev/)Go Programming Language. By default, the operator has the Go instrumentation disabled. The Helm command has the “extraArgs” parameter to enable it.
The “admissionWebhooks” parameter asks Cert-Manager to generate a self-signed certificate. The operator installs some new CRDs used to create a new OpenTelemetry Collector. You can check them out with:
- The collector requires the Dynatrace Endpoint and API Token to connect. They are stored as Kubernetes secrets and are referred to in the “env” section.
-
The config section has the collector components (receivers and exporters) as well as the “service” section defining the Pipeline.
- The “receivers” section tells us the collector will be listening to ports 4317 and 4318 and will be receiving data over “grpc” and “http”.
- The “exporters” section used the endpoint and the API Token to send data to Dynatrace.
- The “service” section defines the Pipeline. Note we have a simple “attributes processor” defined setting the “kong.deployment.name” attribute as “kong-ecommerce-deployment” to be used by the Dynatrace dashboards.
### Dynatrace Secrets
Before instantiating the collector we need to create the Kubernetes secrets with the Dynatrace endpoint and API Token. The endpoint refers to your Dynatrace tenant:
Based on the declaration, the deployment creates a Kubernetes service named “collector-kong-collector” listening to ports 4317 and 4318. That means that any application, including Kong Data Plane, should refer to the OTel Collector's Kubernetes FQDN (e.g., http://collector-kong-collector.opentelemetry-operator-system.svc.cluster.local:4318/v1/traces) to send data to the collector. The [“/v1/traces”](https://opentelemetry.io/docs/specs/otlp/#otlphttp-request)“/v1/traces” path is the default the collector uses to handle requests with trace data.
% kubectl get service collector-kong-collector -n opentelemetry-operator-system
NAME                       TYPE        CLUSTER-IP      EXTERNAL-IP   PORT(S)                      AGE
collector-kong-collector   ClusterIP   10.100.23.139   <none>        4317/TCP,4318/TCP   29m
## 6. e-commerce application instrumentation and deployment
Here's a diagram illustrating how Auto-Instrumentation works. The instrumentation depends on the Programming Language we used to develop the microservices. For some languages, the CRD uses the OTLP HTTP protocol, which is configured in the OTel Collector listening to port 4318. That's the case of all languages, excluding Node.js, where the CRD uses gRPC and therefore should refer to port 4317.
The instrumentation process is divided into two steps:
- Configuration using the `Instrumentation` Kubernetes CRD
- Kubernetes deployment annotations to get the code instrumented.
### Instrumentation Configuration
First of all, we need to use the `Instrumentation` CRD installed to configure it. Here's the declaration:
- As we mentioned earlier, the OTLP endpoint the Instrumentation should use depends on the Programming Language. The declaration has a specific configuration for each one of them.
- Lastly, as an exercise, for the Go Lang section, we've configured the OTel service name as well as the Image the Auto-Instrumentation process should use.
Configure the Auto-Instrumentation process by submitting the declaration:
kubectl apply -f otel-instrumentation.yaml
If you want to delete it run:
kubectl delete instrumentation instrumentation1
### Application deployment
Now, with the Auto-Intrumentation process properly instructed, let's deploy the Application. The original Kubernetes declaration can be downloaded from:
There are two main points we should change in order to get the Application properly deployed:
- Originally, the frontend microservice is configured to communicate directly with each one of the backend microservices (Inventory, Pricing and Coupon). We need to change that saying it should send requests to Kong API Gateway instead.
- In order to get instrumented, each microservice has to have specific annotations so the Auto-Instrumentation process can take care of it and inject the necessary code into it.
#### Frontend deployment declaration
Here's the original Frontend microservice deployment declaration:
You can manually update the declaration or use the [yq](https://github.com/mikefarah/yq)yq tool. yq is a powerful YAML, JSON and XML text processor very useful if you want to automate the process.
The following commands update the “env” section, replacing the original endpoint with Kong references, including the Kong's Kubernetes Service FQDN (“kong-kong-proxy.kong”) and the Kong Route (e.g. “/inventory"). We don't have the Kong Routes defined yet as it is what the next section of the document describes. Please check the [yq documentation](https://mikefarah.gitbook.io/yq)yq documentation to learn more about it.
yq -i e 'select(.kind == "Deployment" and .metadata.name == "frontend").spec.template.spec.containers[0].env[0].value |= "kong-kong-proxy.kong/inventory"' deployment.yaml

yq -i e 'select(.kind == "Deployment" and .metadata.name == "frontend").spec.template.spec.containers[0].env[1].value |= "kong-kong-proxy.kong/pricing"' deployment.yaml

yq -i e 'select(.kind == "Deployment" and .metadata.name == "frontend").spec.template.spec.containers[0].env[2].value |= "kong-kong-proxy.kong/coupon"' deployment.yaml
#### Kubernetes deployment annotations
The second update is going to add Kubernetes annotations so the Auto-Instrumentation process can do its jobs. Here are the yq commands. Note that for each microservice, we use a different [annotation](https://opentelemetry.io/docs/kubernetes/operator/automatic/#add-annotations-to-existing-deployments)annotation to tell the Auto-Instrumentation process which Programming Language it should consider. For example, the “Inventory” microservice, written in Python, has the `"instrumentation.opentelemetry.io/inject-python": "true"` annotation injected.
To get a better understanding of the manipulation the Auto-Instrumentation process does, let's check, for example, the “Inventory” Pod, where the microservice is written in Python. If you run:
kubectl get pod -o yaml $(kubectl get pod -o json | \
  jq '.items[].metadata | select(.name | startswith("inventory"))' | \
  jq -r '.name') | yq '.spec'
Another interesting check is the “Membership” Pod. Since the microservice is written in Go, the Auto-Instrumentation solves the problem in a different way. To check that out, if you run:
kubectl get pod -o yaml $(kubectl get pod -o json | \
  jq '.items[].metadata | select(.name | startswith("membership"))' | \
  jq -r '.name') | yq '.spec.containers[].name'
Below you can see two decK declarations. The first one defines Kong Services and Routes. The second manages the Kong Plugins.
For the first declaration here are the main comments:
- A Kong Service for each e-commerce Backend microservice (Coupon, Inventory, and Pricing). Note that, since the Membership microservice is not consumed directly by the Frontend microservice, we don't need to define a Kong Service for it.
- A Kong Route for each Kong Service to expose them with the specific paths “/coupon”, “/inventory” and “/pricing”. Each Kong Route matches the Kubernetes declaration update we did for the Frontend microservice.
- A globally configured Kong OpenTelemetry Plugin, meaning it's going to be applied to all Kong Services. The main configuration here is the “traces_endpoint” parameter. As you can see, it refers to the OpenTelemetry Collector instance we deployed previously.
- The Plugin supports the OpenTelemetry Context Propagation, which defines the W3C TraceContext specification as the default propagator.
- The Plugin sets “kong-otel” as the name of the Service getting monitored.
The Kong Gateway OpenTelemetry Plugin supports other propagators through the following headers: Zipkin, Jaeger, OpenTracing, Datadog, AWS X-Ray, and GCP X-Cloud-Trace-Context. The plugin also allows us to extract, inject, clear or preserve header to and out of the incoming requests.
Now, before submitting the declaration to Konnect to create the Kong Objects, you can test the connection first. Please, define a PAT environment variable with your Konnect PAT.
Still inside the “service” section we have included the new “logs” pipeline. Its “receivers” are set to “otlp” and “tcplog” to get data from both Kong Gateway Plugin. Its “exporters” is set to the same “otlphttp” which sends data to Dynatrace.
### Kubernetes Service Account for Prometheus Receiver
One of the relabeling configs is related to the port 8100. This port configuration is part of the Data Plane deployment we used to get it running. Here's the snippet of the “values.yaml” file we used previously:
That's the Kong Gateway's Status API where the Prometheus plugin exposes the metrics produced. In fact, the endpoint the receiver scrapes is, as specified in the OTel Collector configuration.
http://<Data_Plane_Pod_IP>:8100/metrics
On the other hand, the OTel Collector has to be allowed to scrape the endpoint. We can define such permission with a Kubernetes ClusterRole and apply it to a Kubernetes Service Account with a Kubernetes ClusterRoleBinding.
Here's the ClusterRole declaration. It's a quite open one but it's good enough for this exercise.
Finally, note that the OTel Collector configuration is deployed using the Service Account with `serviceAccount: collector` and then it will be able to scrape the endpoint exposed by Kong Gateway.
### Deploy the collector
Delete the current collector first and instantiate a new one simply submitting the declaration:
Interestingly enough, the collector service now listens to four ports:
% kubectl get service collector-kong-collector -n opentelemetry-operator-system
NAME                       TYPE        CLUSTER-IP     EXTERNAL-IP   PORT(S)                                AGE
collector-kong-collector   ClusterIP   10.100.67.18   <none>        4317/TCP,4318/TCP,8889/TCP,54525/TCP   21h
### Configure the Prometheus and TCP Log Plugins
Add the Prometheus and TCP Log plugins to our decK declaration and submit it to Konnect:
Continue navigating the Application to see some metrics getting generated. In another terminal send a request to Prometheus’ endpoint.
% http :8889/metrics
You should see several related Kong metrics including, for example, Histogram metrics like “kong_kong_latency_ms_bucket”, “kong_request_latency_ms_bucket” and “kong_upstream_latency_ms_bucket”. Maybe one of the most important is “kong_http_requests_total” where we can see consumption metrics. Here's a snippet of the output:
# HELP kong_http_requests_total HTTP status codes per consumer/service/route in Kong
# TYPE kong_http_requests_total counter
kong_http_requests_total{code="200",instance="192.168.76.233:8100",job="otel-collector",route="coupon_route",service="coupon_service",source="service",workspace="default"}1kong_http_requests_total{code="200",instance="192.168.76.233:8100",job="otel-collector",route="inventory_route",service="inventory_service",source="service",workspace="default"}1kong_http_requests_total{code="200",instance="192.168.76.233:8100",job="otel-collector",route="pricing_route",service="pricing_service",source="service",workspace="default"}1
In order to do it, the log event has to have a “trace_id” field with the actual trace id it is related to. By default, the OpenTelemetry Plugin injects such a field. However, it adds the format used, in order case “w3c”. For example:
As you can see [here](https://docs.konghq.com/gateway/latest/plugin-development/custom-logic/#plugins-execution-order)here, the TCP Log gets executed after the OpenTelemetry Plugin. So, to solve that, the TCP Log Plugin configuration has the “custom_fields_by_lua” set with a Lua code which removes the “w3c” part out of the field added by the OpenTelemetry Plugin. The new log event can then follow the format Dynatrace looks for:
Here's a Dynatrace Logs app with events generated by the TCP Log Plugin. Choose an event and you'll see the right panel with the “Open trace” button.
If you click on it, you can choose to get redirected to the Dynatrace Trace apps. In the “Distributed Tracing” app you should see the trace with all spans related to it.
## Conclusion
The synergy of Dynatrace and Kong Konnect technologies provides a new era of observability architectures built on OpenTelemetry standards. By leveraging the combined capabilities of these technologies, organizations can strengthen their infrastructure with robust policies, laying a solid foundation for advanced observability platforms.
Understanding and monitoring the performance and health of applications and systems is critical. This is where observability comes into play. Observability is about gaining a comprehensive understanding of a system's internal state by analyzing the
Claudio Acquaviva
# AI Voice Agents with Kong AI Gateway and Cerebras
Kong Gateway is an API gateway and a core component of the Kong Konnect platform . Built on a plugin-based extensibility model, it centralizes essential functions such as proxying, routing, load balancing, and health checking, efficiently manag
Claudio Acquaviva
# Exposing and Controlling Apache Kafka® Data Streaming with Kong Konnect and Confluent Cloud
We announced the Kong Premium Technology Partner Program at API Summit 2024, and Confluent was one of the first in the program. This initial development was all about ensuring that the relationship between Kong and Confluent — from a business an
Claudio Acquaviva
# Orchestrating Konnect’s Great API Renaming with Kong Gateway Transformer Plugins
Before we dive in, we want to remind our readers that the Konnect engineering team actively uses Kong products like Kong Gateway, Kong Mesh, and Insomnia. In this post, we'll showcase the power of Kong Gateway and two plugins — the JQ and Request T
Danny Freese
# Building End to End Observability in Kong Konnect Infrastructure
As infrastructure becomes more and more distributed, building better observability around it is becoming crucial. With the emergence of microservices architecture, teams want to gain better visibility with proper observability built into the archite
Deepak Mohandas
# Local Previews and Agent-Driven Authoring for Your Konnect Dev Portal
What it is
The Konnect Dev Portal Toolkit is a free extension published by Kong Inc. on the Visual Studio Code Marketplace (ID konghq.vscode-konnect-dev-portal-toolkit) and on Open VSX.
Konnect Developer Portals are how teams publish API document
Adam DeHaven
# Kafka in a DMZ: Protecting AWS MSK with Kong Event Gateway
The MSK exposure problem
Amazon MSK brokers live in private subnets by default. That's the right default. Kafka's protocol wasn't designed for untrusted networks — it has no concept of rate limiting, no built-in field-level encryption, and its ACL
Hugo Guerrero
# Kong Konnect Observability and Analytics with Dynatrace
Understanding and monitoring the performance and health of applications and systems is critical. This is where observability comes into play. Observability is about gaining a comprehensive understanding of a system's internal state by analyzing the
Claudio Acquaviva
# AI Voice Agents with Kong AI Gateway and Cerebras
Kong Gateway is an API gateway and a core component of the Kong Konnect platform . Built on a plugin-based extensibility model, it centralizes essential functions such as proxying, routing, load balancing, and health checking, efficiently manag
Claudio Acquaviva
# Exposing and Controlling Apache Kafka® Data Streaming with Kong Konnect and Confluent Cloud
We announced the Kong Premium Technology Partner Program at API Summit 2024, and Confluent was one of the first in the program. This initial development was all about ensuring that the relationship between Kong and Confluent — from a business an
Claudio Acquaviva
# Orchestrating Konnect’s Great API Renaming with Kong Gateway Transformer Plugins
Before we dive in, we want to remind our readers that the Konnect engineering team actively uses Kong products like Kong Gateway, Kong Mesh, and Insomnia. In this post, we'll showcase the power of Kong Gateway and two plugins — the JQ and Request T
Danny Freese
# Building End to End Observability in Kong Konnect Infrastructure
As infrastructure becomes more and more distributed, building better observability around it is becoming crucial. With the emergence of microservices architecture, teams want to gain better visibility with proper observability built into the archite
Deepak Mohandas
# Local Previews and Agent-Driven Authoring for Your Konnect Dev Portal
What it is
The Konnect Dev Portal Toolkit is a free extension published by Kong Inc. on the Visual Studio Code Marketplace (ID konghq.vscode-konnect-dev-portal-toolkit) and on Open VSX.
Konnect Developer Portals are how teams publish API document
Adam DeHaven
# Kafka in a DMZ: Protecting AWS MSK with Kong Event Gateway
The MSK exposure problem
Amazon MSK brokers live in private subnets by default. That's the right default. Kafka's protocol wasn't designed for untrusted networks — it has no concept of rate limiting, no built-in field-level encryption, and its ACL
Hugo Guerrero
## Ready to see Kong in action?
Get a personalized walkthrough of Kong's platform tailored to your architecture, use cases, and scale requirements.