# Optimizing the Prometheus StatsD Exporter for Cloud Scale
Wangchong Zhou
[Kong Cloud](https://konghq.com/cloud)Kong Cloud has been using StatsD and Prometheus heavily in monitoring and metrics collecting. In this blog post we discuss the use case of StatsD and Prometheus on Kong Cloud, the performance problem we found, and the way we proposed to solve it.
## **What is StatsD?**
StatsD is a metrics server that accepts events from UDP or TCP protocol and export them to various backends. A typical StatsD event looks like:
`host.sfo1.request.count:123|c`
Every StatsD event is a string in a format of `<metricname>:<value>|<type>`. The above example represents a metric called `host.sfo1.request.count` with the type of `counter` and the value of `123`.
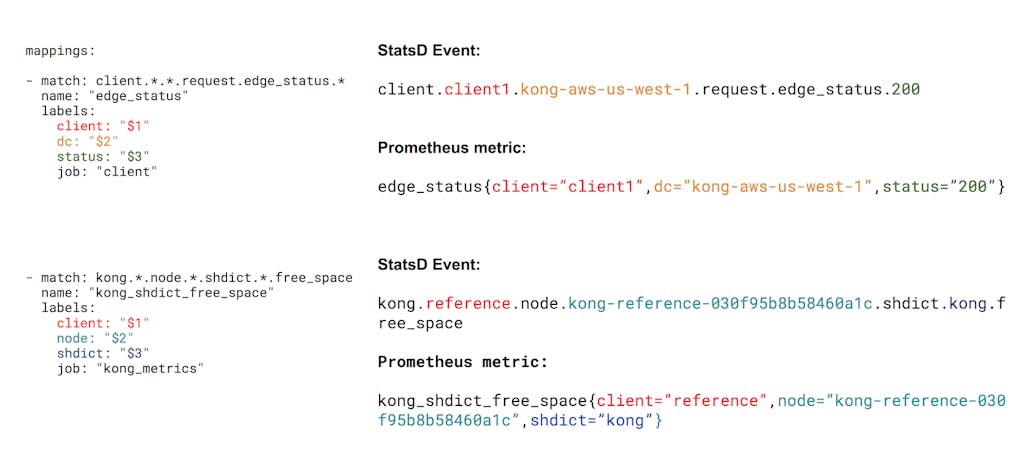
In the example below, two StatsD events are translated according to the mapping config to the left.
## **The Problem**
On Kong Cloud, various StatsD events are generated for each request. When the client request rate climbed up to several thousand requests per second, we spotted a high CPU usage of the StatsD exporter that took one and a half cores on an AWS m4.large instance.
The largest accumulation of events was system calls. This makes sense, as every UDP socket operation involves a system call. What caught our interest was that the total CPU time taken for the Go regular expression engine was around 37 percent of the CPU, which was twice the system calls.
We also tried rebuilding the StatsD exporter from the source using Go 1.10.3, which gave us this result:
Go 1.10.3 definitely had a better performance in the framework itself and gave us 19 percent CPU time in system calls and 40 percent CPU time in the regular expression engine.
## **Finding a Solution**
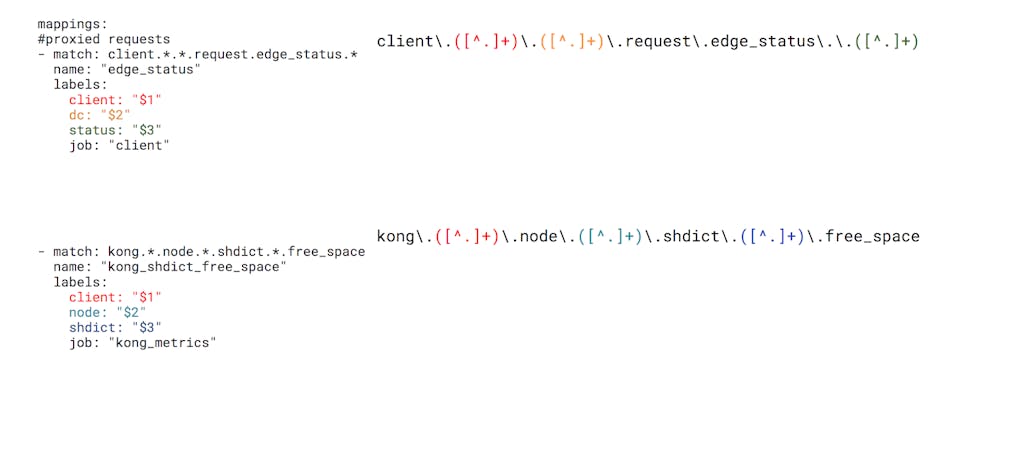
Since the largest portion of CPU was used in regular expression matching, we started to look into the source code of the StatsD exporter. The exporter uses regular expression to match rules and expand labels from matching groups. For example, the mapping config we see in the first section generates the following regular expressions:
All labels will be expanded using the `regex.ExpandString` function.
After reviewing the rules we used on Kong Cloud, it turned out that we didn’t actually need the full power of regular expressions because:
- We always use the `.*.` pattern to match the whole field, which is separated by dot. There’s no use case in which we need to use complex expressions like `host.*.status.\d+`.
- We always use only one capture group as a label. There’s no use case like `host: "$1_$2"`.
Based on this observation, we started to refactor the StatsD exporter with a light-weight matcher with limited features that was just enough to suit our use cases. Then we implemented a `simple` matching type in addition to the glob and regex matching type using a finite state machine to mock the behaviour of regular expression matching.
### **Simple Matcher Preparation**
Every time the mapper rule is reloaded, the exporter will build a state machine following these steps:
- Read rules from yaml and split each rule by dot.
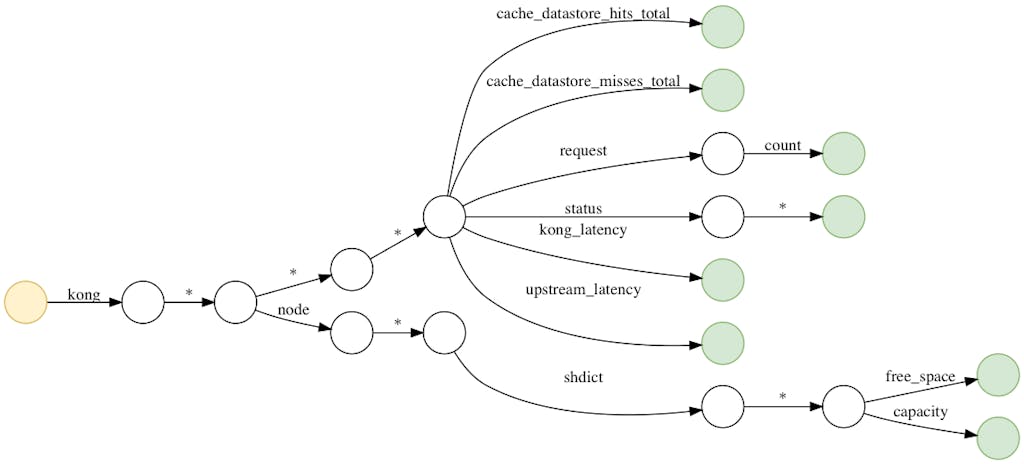
- Build a state machine using each split field. Each field represents a state in the state machine. For example, the following rules–
- For labels, replace regex expansion variables with `%s` and record the regex variable stored in struct labelFormatter. For example, `client_$1` becomes:
type labelFormatter struct {
    captureIdx int
    fmtString string
}
### Simple matcher matching
- When a StatsD event comes in, split each event with dot.
- For each split field, do a traversal through the state machine. Each lookup of the next transition in state uses the go `map` structure, thus is O(1) time complexity each time.
- If the current transition state is a *, also put the current field to an array.
- * always matches but has a lower priority than exact match. For example, client.abc will always match rule client.abc before client.* regardless of the order of occurrence in the statsd.rules file.
- If the state ends in a matched state and there’s no split field left, this is a successful match. o to step 4; otherwise fall back to glob or regex matching.
- Format labels using the captured groups stored in the array.
- Return the matched rule and the formatted labels to the exporter and go to step 1.
## **Performance Comparison**
We reran the perf and pprof profiling again with the workload with simple matching type enabled and received the following:
**StatsD Exporter version****Syscall CPU percentage (prorated)****Time taken to finish 100000 mapping iterations**Stock Binary20.36%N/AGo 1.10.323.39%1.655sOur Version42.23%1.003s*+19%*-39%
The CPU percentage in Syscall is larger the better under the same workload.
Now, we have less than five percent of CPU time spent in Go's regular expression library. Those are the functions called in Prometheus `client_golang` library.
We also ran a test which iterated the matching function only for 100,000 times, and we had 40 percent less time compared to glob matching type. If glob matching is not used as a fallback when simple matching can’t find a match and is completely removed, we had 60 percent time less spent in iteration.
## **Simple Matcher Caveats**
There are a few caveats with simple matcher:
- Rules that need backtracking:
`client.*.request.size.*` `client.*.*.size.*`
The above will fail to match if the event is `client.aaa.response.size.100` Correct rules are: `client.*.response.status.*` `client.*.response.size.*`
- Rules that depend on the order of occurrence in statsd.rules (possible to use array to trade with performance if needed)
- Labels that have multiple regex expansion variables (possible to support if needed)
Kong Cloud delivers faster innovation through zero-touch, automatic updates and cloud-speed cadence of new product functionality. It offers the unique flexibility of running on any cloud option, including AWS, Azure and Google Cloud. Kong Cloud is currently in beta and will be available to the general public soon. To learn more about Kong Cloud, sign up for product updates at [https://konghq.com/cloud/](https://konghq.com/cloud)https://konghq.com/cloud/.
API gateways and load balancers are useful tools for building modern applications. While they have some functionality overlaps, they're distinct tools with different purposes and use cases. In this article, we'll discuss the differences between API
Ahmed Koshok
# Migration Options for IBM Cloud API Gateway Customers
IBM recently announced the deprecation of its Cloud API Gateway, a service used to create and manage APIs by placing a gateway in front of existing IBM Cloud endpoints. With this move, IBM Cloud Functions and IBM Cloud Foundry are no longer able to
Syed Mahmood
# Building Kong Clusters in AWS with the Terraform API Gateway Module
We created the Terraform API gateway module to help you follow DevOps best practices while implementing Kong using infrastructure as code (IaC). Terraform is an open source tool that allows you to implement IaC using a declarative declaration defini
Kong
# Why Your Kafka Event Streams Need an Event Gateway
You wouldn't expose a REST API without a gateway. What about Kafka?
Before we talk about an event gateway, it's worth grounding ourselves on what an event is. An event is simply a record of something that happened. In modern integration, there are
Warren Vella
# A Unified Gateway for APIs + Agentic Applications on VMware VKS with Kong Konnect
Built on top of Kong API Gateway, the Kong AI Gateway is designed to address key challenges in enterprise AI adoption. Modern AI applications rarely rely on a single model; instead, they orchestrate multiple GenAI providers, agent frameworks, Age
Anika Suri
# Building a Secure, Scalable AI Infrastructure with Kong and Akamai: A Technical Introduction
Together, the following components represent the three layers of the new AI platform: AI Gateway: Kong AI Gateway (including MCP support) controls both GenAI and MCP flow and orchestrates the existing services like Vector Databases, Event Streaming,
Marco Raffaelli
# Beyond Static Routing: Modernizing API Logic with Conditional Policy Execution
Imagine you have a single Service, order-api . You want to apply a strict rate limit to most traffic, but you want to bypass that limit—or apply a different one—if the request contains a specific X-App-Priority: High header. Previously, you had t
Hugo Guerrero
# API Gateway vs Load Balancer: Which is Right for Your Application?
API gateways and load balancers are useful tools for building modern applications. While they have some functionality overlaps, they're distinct tools with different purposes and use cases. In this article, we'll discuss the differences between API
Ahmed Koshok
# Migration Options for IBM Cloud API Gateway Customers
IBM recently announced the deprecation of its Cloud API Gateway, a service used to create and manage APIs by placing a gateway in front of existing IBM Cloud endpoints. With this move, IBM Cloud Functions and IBM Cloud Foundry are no longer able to
Syed Mahmood
# Building Kong Clusters in AWS with the Terraform API Gateway Module
We created the Terraform API gateway module to help you follow DevOps best practices while implementing Kong using infrastructure as code (IaC). Terraform is an open source tool that allows you to implement IaC using a declarative declaration defini
Kong
# Why Your Kafka Event Streams Need an Event Gateway
You wouldn't expose a REST API without a gateway. What about Kafka?
Before we talk about an event gateway, it's worth grounding ourselves on what an event is. An event is simply a record of something that happened. In modern integration, there are
Warren Vella
# A Unified Gateway for APIs + Agentic Applications on VMware VKS with Kong Konnect
Built on top of Kong API Gateway, the Kong AI Gateway is designed to address key challenges in enterprise AI adoption. Modern AI applications rarely rely on a single model; instead, they orchestrate multiple GenAI providers, agent frameworks, Age
Anika Suri
# Building a Secure, Scalable AI Infrastructure with Kong and Akamai: A Technical Introduction
Together, the following components represent the three layers of the new AI platform: AI Gateway: Kong AI Gateway (including MCP support) controls both GenAI and MCP flow and orchestrates the existing services like Vector Databases, Event Streaming,
Marco Raffaelli
# Beyond Static Routing: Modernizing API Logic with Conditional Policy Execution
Imagine you have a single Service, order-api . You want to apply a strict rate limit to most traffic, but you want to bypass that limit—or apply a different one—if the request contains a specific X-App-Priority: High header. Previously, you had t
Hugo Guerrero
## Ready to see Kong in action?
Get a personalized walkthrough of Kong's platform tailored to your architecture, use cases, and scale requirements.