# Prometheus and Grafana APM on Kubernetes Ingress
Joseph Caudle
While monitoring is an important part of any robust application deployment, it can also seem overwhelming to get a full application performance monitoring (APM) stack deployed. In this post, we'll see how operating a Kubernetes environment using the open-source [Kong Ingress Controller](https://konghq.com/solutions/kubernetes-ingress)Kong Ingress Controller can simplify this seemingly daunting task! You’ll learn how to use Prometheus and Grafana on Kubernetes Ingress to simplify APM setup.
It's important to note that this implementation will be more of a demonstration than an instruction manual on deploying to a production environment. We're going to use [kind](https://kind.sigs.k8s.io)kind to create our Kubernetes cluster, making it easy to follow along on your local machine. From here, you'll have a foundation that will translate easily to your production-ready business applications.
## **Getting Going With a Kubernetes Cluster on kind**
% kind create cluster --name kong
Creating cluster "kong" ...
✓ Ensuring node image (kindest/node:v1.21.1) 🖼
✓ Preparing nodes 📦
✓ Writing configuration 📜
✓ Starting control-plane 🕹️
✓ Installing CNI 🔌
✓ Installing StorageClass 💾
Set kubectl context to "kind-kong"You can now use your cluster with:
kubectl cluster-info --context kind-kong
Have a question, bug, or feature request? Let us know! https://kind.sigs.k8s.io/#community 🙂
## **Installing Prometheus and Grafana**
Now, we're ready to get our monitoring stack deployed. It may seem a little strange to start with the monitoring rather than our Kubernetes service. Still, this way, we will know immediately if Kong is connected properly to Prometheus and Grafana. We'll start by adding repos for Prometheus and Grafana:
% helm repo add prometheus-community https://prometheus-community.github.io/helm-charts"prometheus-community" has been added to your repositories
% helm repo add grafana https://grafana.github.io/helm-charts"grafana" has been added to your repositories
If you've already installed these repositories, just make sure to run helm repo update to ensure you have up-to-date Helm charts.
We'll start with Prometheus configuration. The first step is to configure the scrape interval for Prometheus. We want our system to check for metrics every 10 seconds. We can do that with the following YAML:
That should display a message saying, "For more information on running Prometheus, visit: https://prometheus.io/." Notice that we created a new namespace for cluster monitoring. This will allow us to keep things clean in our K8s cluster.
While our Prometheus installation is configuring, we'll set up Grafana as well. Let's start with this YAML:
grafana.yaml
persistence: enabled:true # enable persistence using Persistent Volumes
datasources: datasources.yaml: apiVersion:1 datasources: # configure Grafana to read metrics from Prometheus
- name: Prometheus
type: prometheus
url: http://prometheus-server # Since Prometheus is deployed in access: proxy # the same namespace, this resolves
# to the Prometheus Server we just installed
isDefault:true # The default data source is Prometheus
dashboardProviders: dashboardproviders.yaml: apiVersion:1 providers: - name: 'default' # Configure a dashboard provider file to
orgId:1 # put the Kong dashboard into.
folder: ''
type: file
disableDeletion:false editable:true options: path: /var/lib/grafana/dashboards/default
dashboards: default: kong-dash: gnetId:7424 # Install the following Grafana dashboard in the
revision:7 # instance: https://grafana.com/dashboards/7424 datasource: Prometheus
A lot is going on in this configuration file, but the comments should give a sufficient explanation. Essentially, when Grafana starts up, we want the Prometheus connection and the Kong dashboard already set up, too, rather than having to go through those steps manually. This file gets us that setup.
The Helm command is very similar to the one for Prometheus:
After running this command, you'll see instructions for getting the admin password for your installation. We'll come back to that soon.
## **Installing and Configuring Kong Gateway**
Now that our monitoring stack is getting going, we can configure Kong to do the heavy lifting in our application. First, we'll make sure to add the Kong Helm chart repo:
% helm repo add kong https://charts.konghq.com"kong" has been added to your repositories
You'll also need to create a YAML for the annotations we want to add to our Kong pod:
kong.yaml
podAnnotations: prometheus.io/scrape:"true" # Ask Prometheus to scrape the
prometheus.io/port:"8100" # Kong pods for metrics
With the YAML in place, let's get Kong installed via Helm:
With our stack fully built out in our kind cluster, we need to see what would happen if we used this sort of stack in production. In particular, we need to set up access to these services from a browser. We'll do that with a few port forwarding rules. In a new terminal session, we use kubectl to look up each piece we've created so far. Then, we set up a rule to visit each service as a localhost application in our browser of choice.
Without closing the terminal session, you should now be able to access different services based on the port:
- localhost:9090 for your Prometheus installation
- localhost:3000 for your Grafana installation
- localhost:8000 for your Kong installation
One thing you'll notice is the login screen for Grafana, where you'll need a password. To obtain that password, use the following command in your original terminal session:
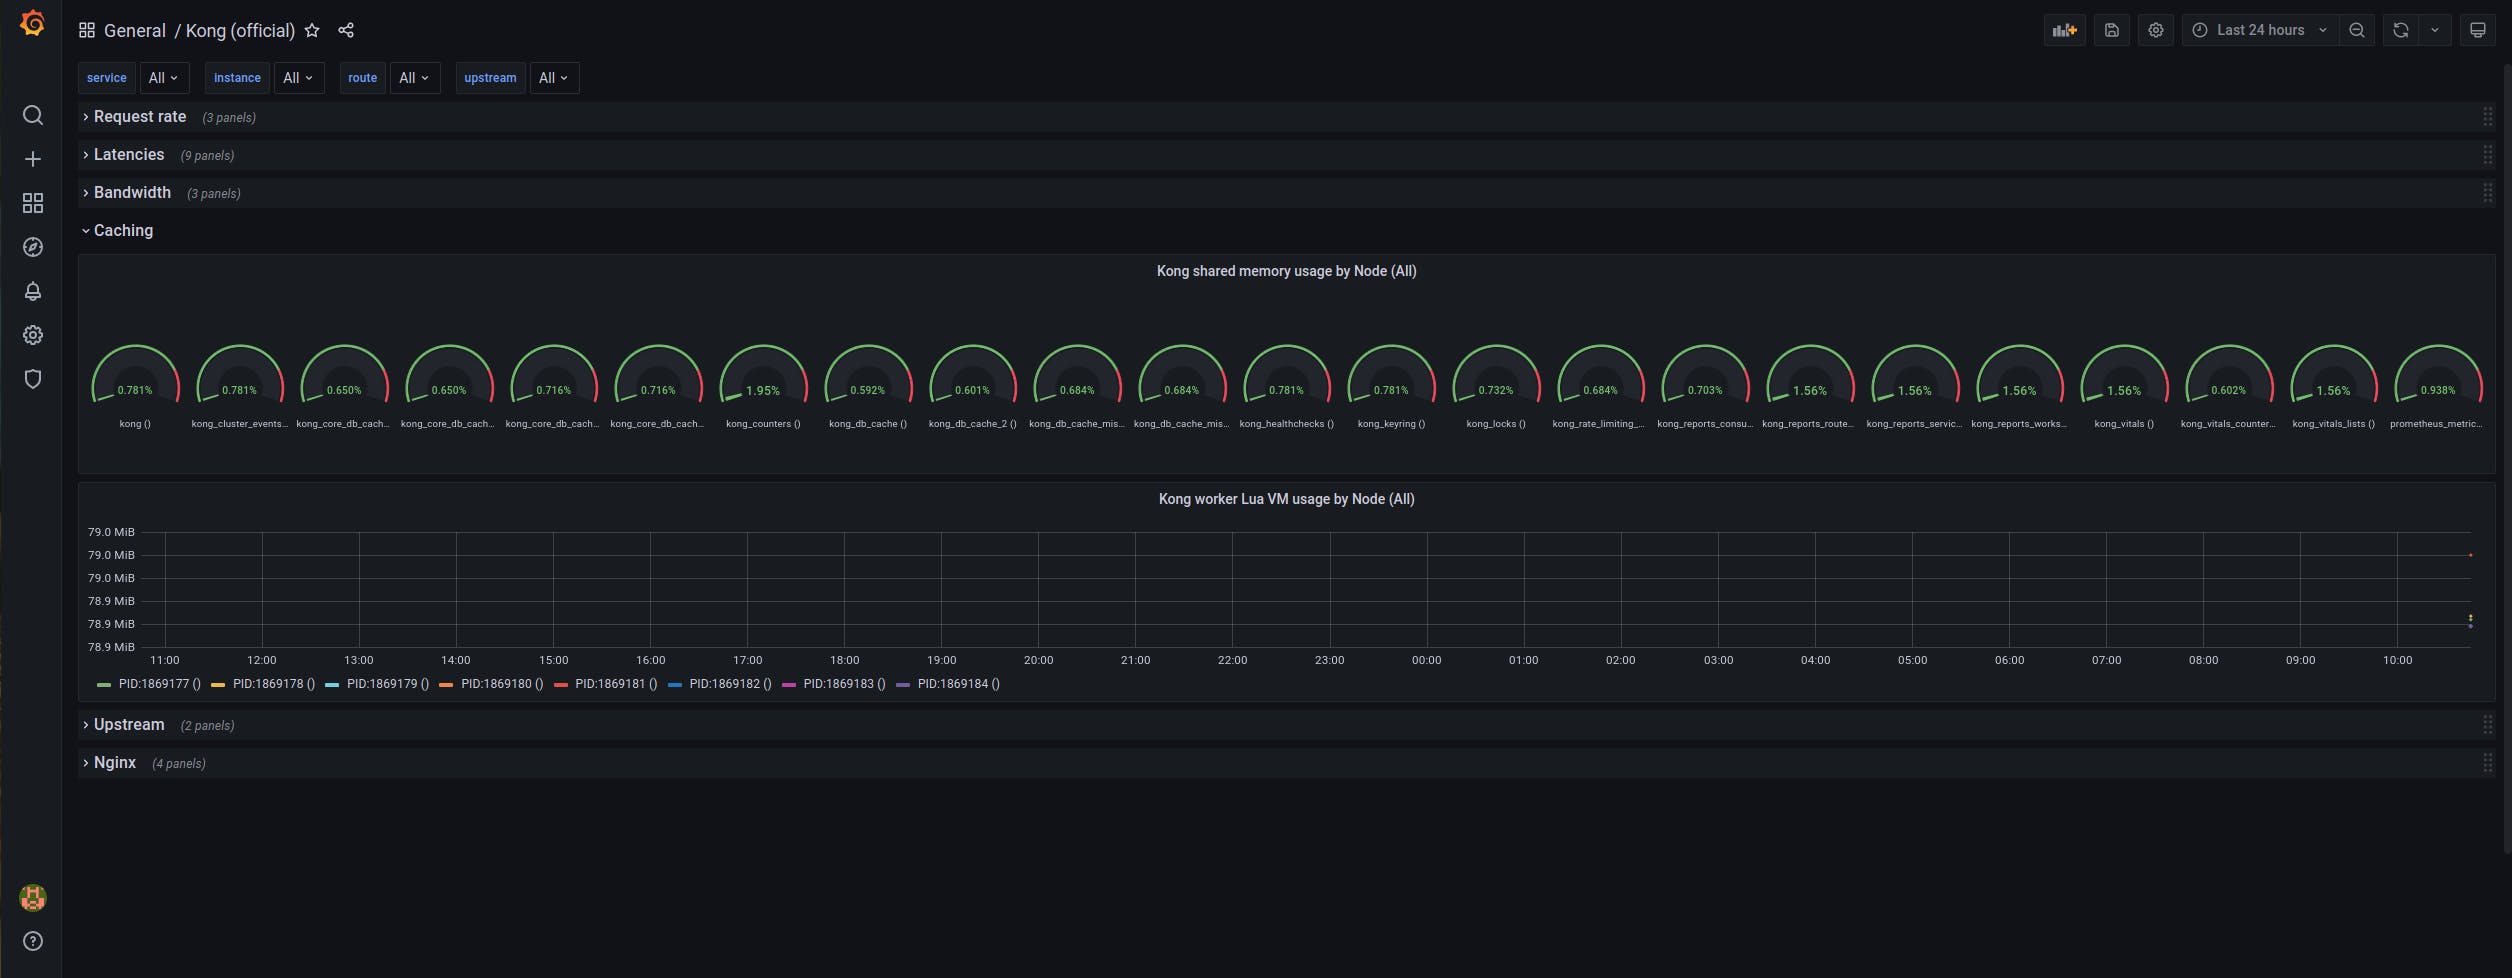
This should give you a 40-character alphanumeric password that you can copy and paste into your browser at [http://localhost:3000/login](http://localhost:3000/login)http://localhost:3000/login as the password, using "admin" as the username. If things are going according to plan, you'll be able to click on the "Kong (official)" Grafana dashboard link and see the Grafana UI:
If your dashboard doesn't say "No data" all over the place, you're in good shape. Otherwise, you might want to review the above steps again to ensure that everything is configured correctly.
## **Let's Demo This Dashboard!**
Finally, let's get our ingress point set up and expose a few sample services. If you were really trying to use this monitoring stack, this is where the deployment of your application would go. For now, we're going to make a few dummy services with the following endpoints:
- /billing
- /invoice
- /comments
We'll use [httpbin](https://httpbin.org)httpbin, which will allow us to simulate a fully functioning service with response codes as we ask for them. We're doing this so we can quickly generate some traffic to our system. That way, things in the dashboard will look like they would if you deployed a real production system to your Kong instance.
% kubectl apply -f services.yaml
deployment.apps/http-svc created
service/billing created
service/invoice created
service/comments created
% kubectl apply -f ingress.yaml
ingress.networking.k8s.io/sample-ingresses created
After a few minutes, those pods should be available, and you can start sending traffic to your services:
% while true;
do
curl http://localhost:8000/billing/status/200 curl http://localhost:8000/billing/status/501 curl http://localhost:8000/invoice/status/201 curl http://localhost:8000/invoice/status/404 curl http://localhost:8000/comments/status/200 curl http://localhost:8000/comments/status/200 sleep 0.01done
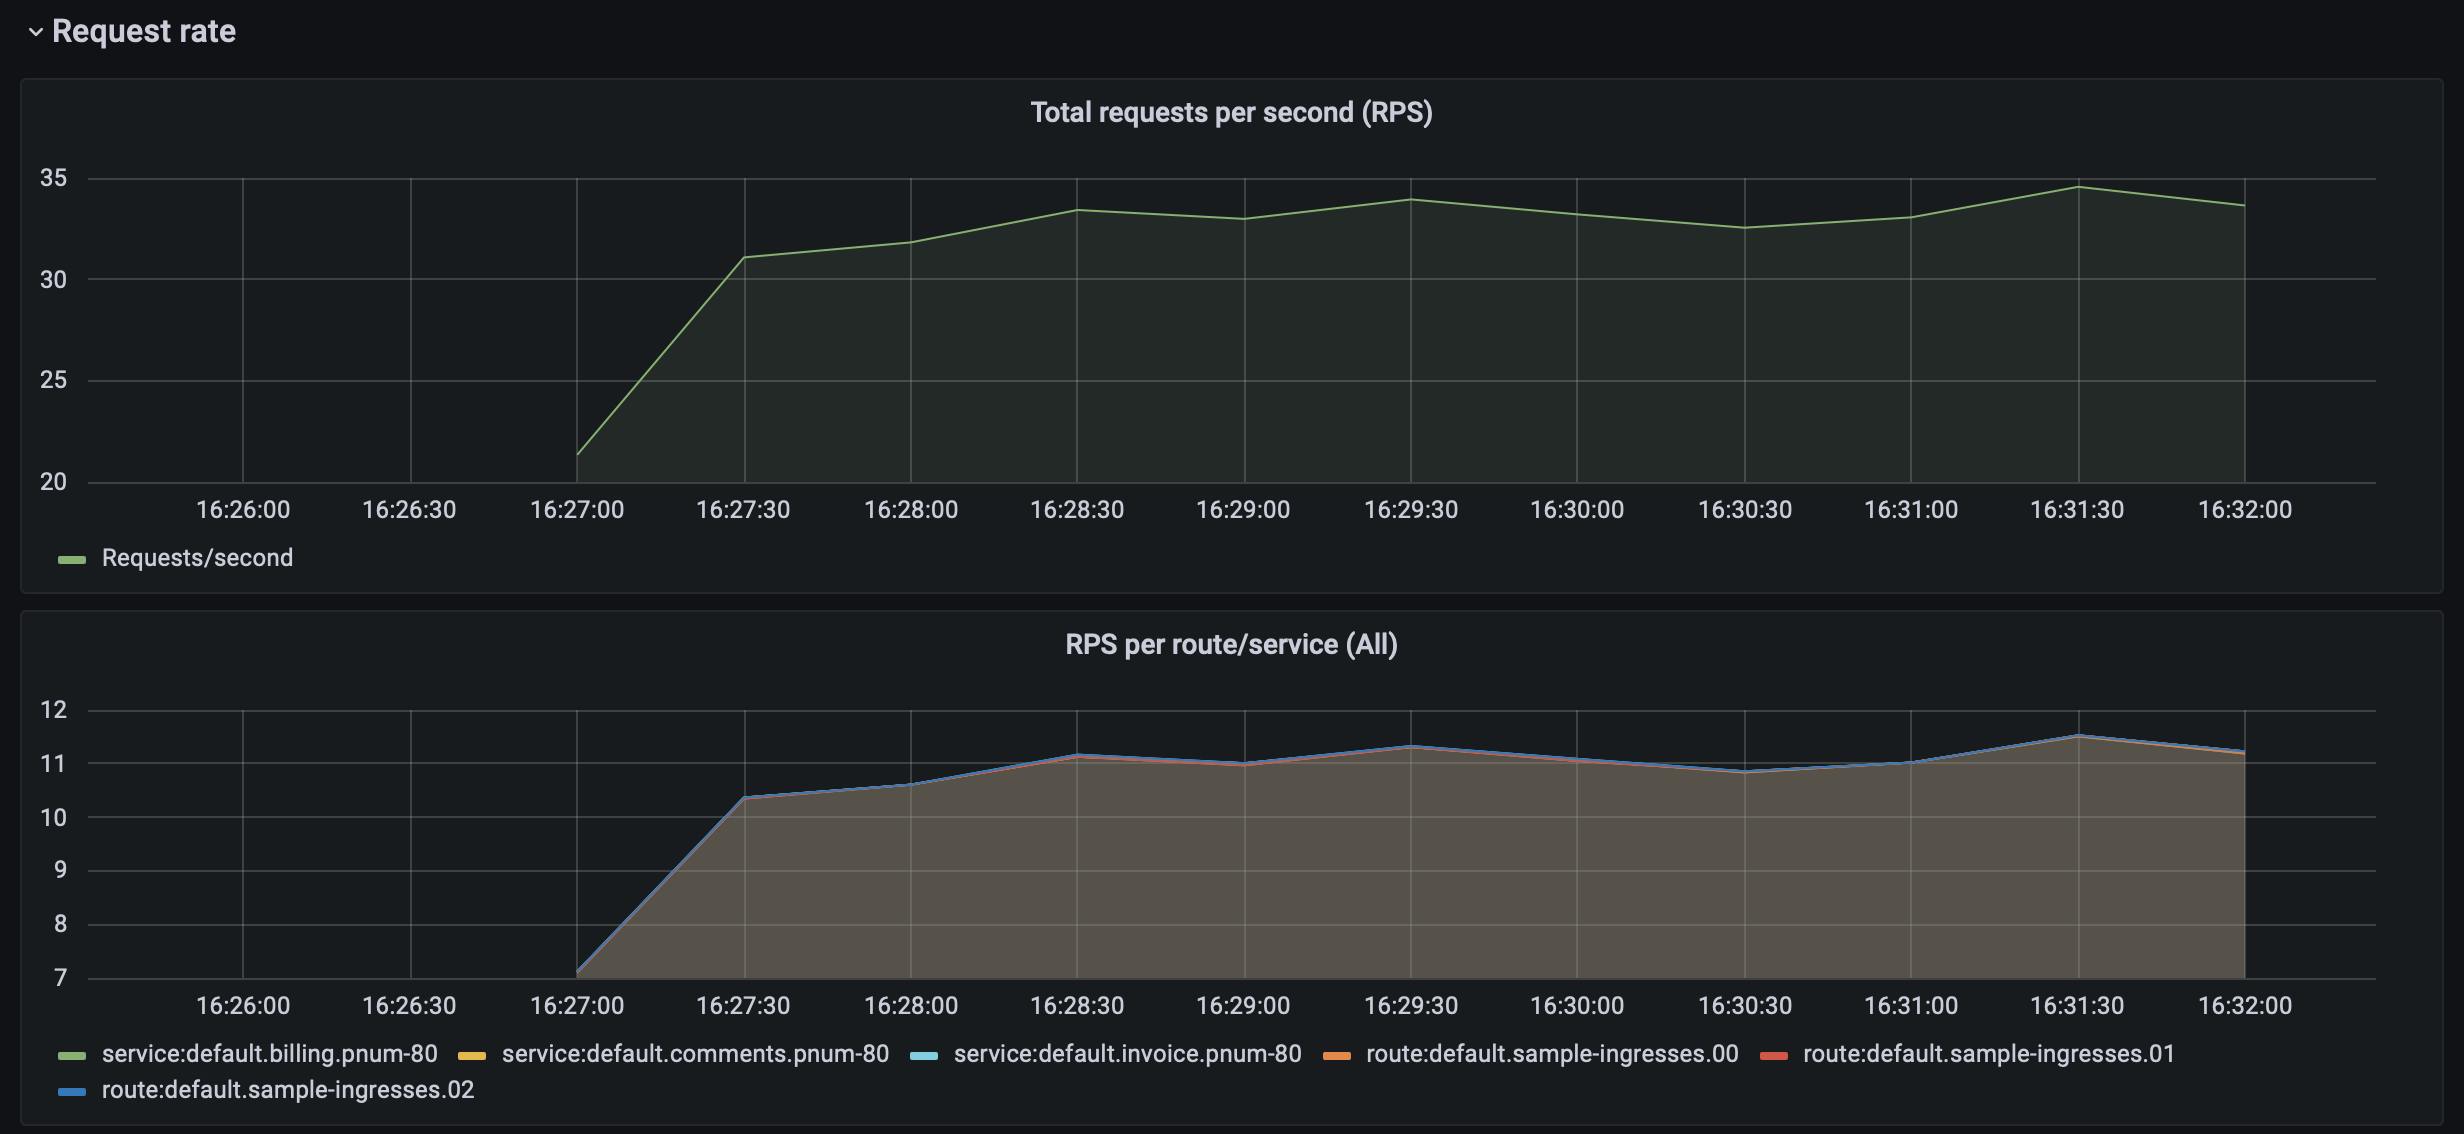
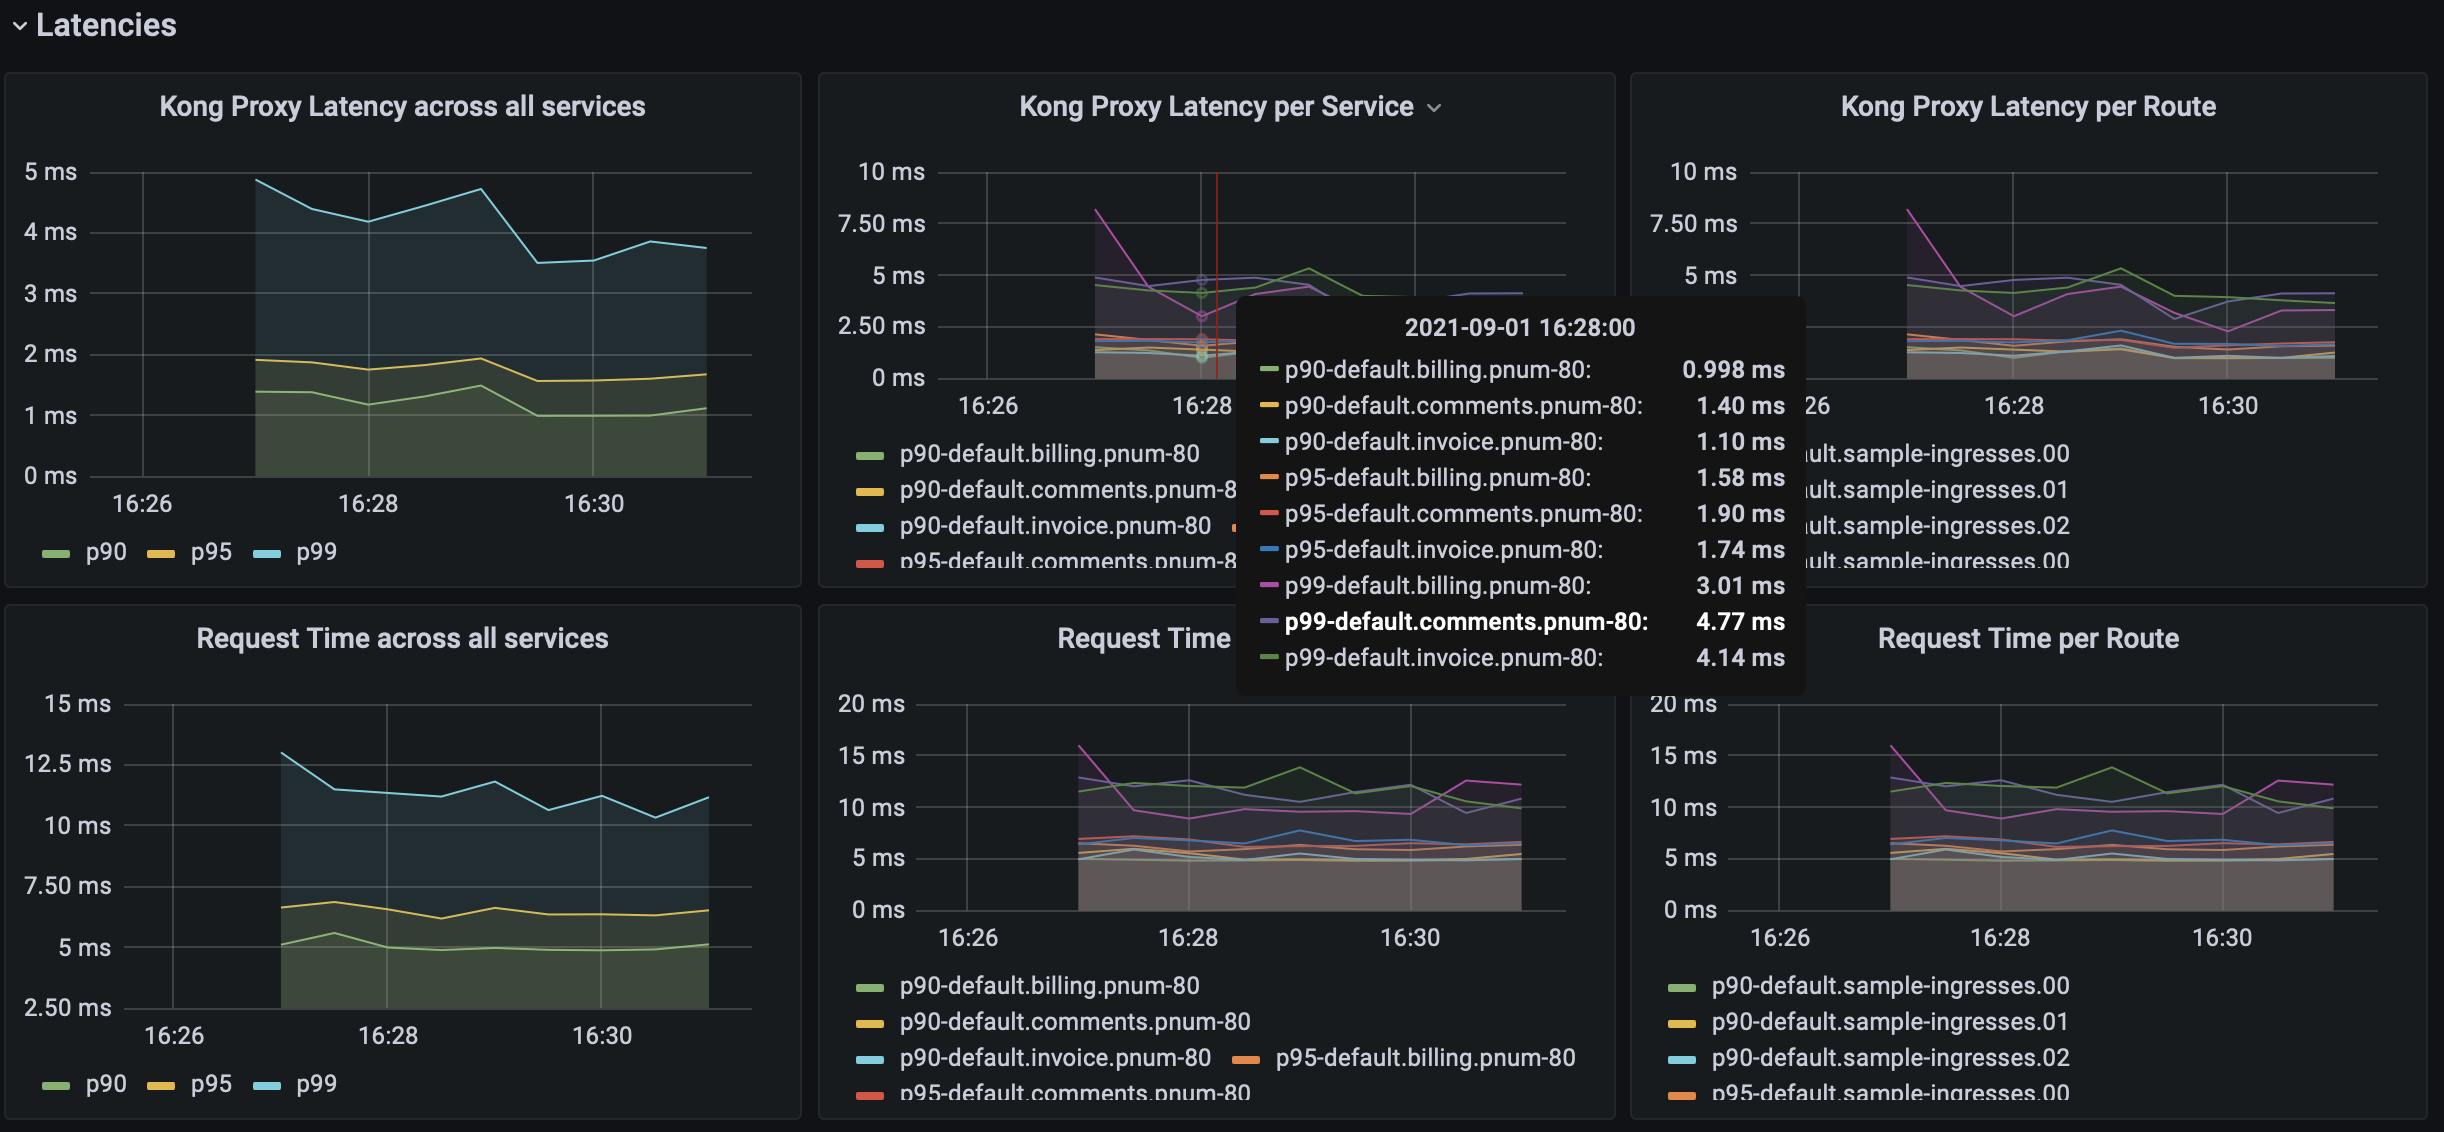
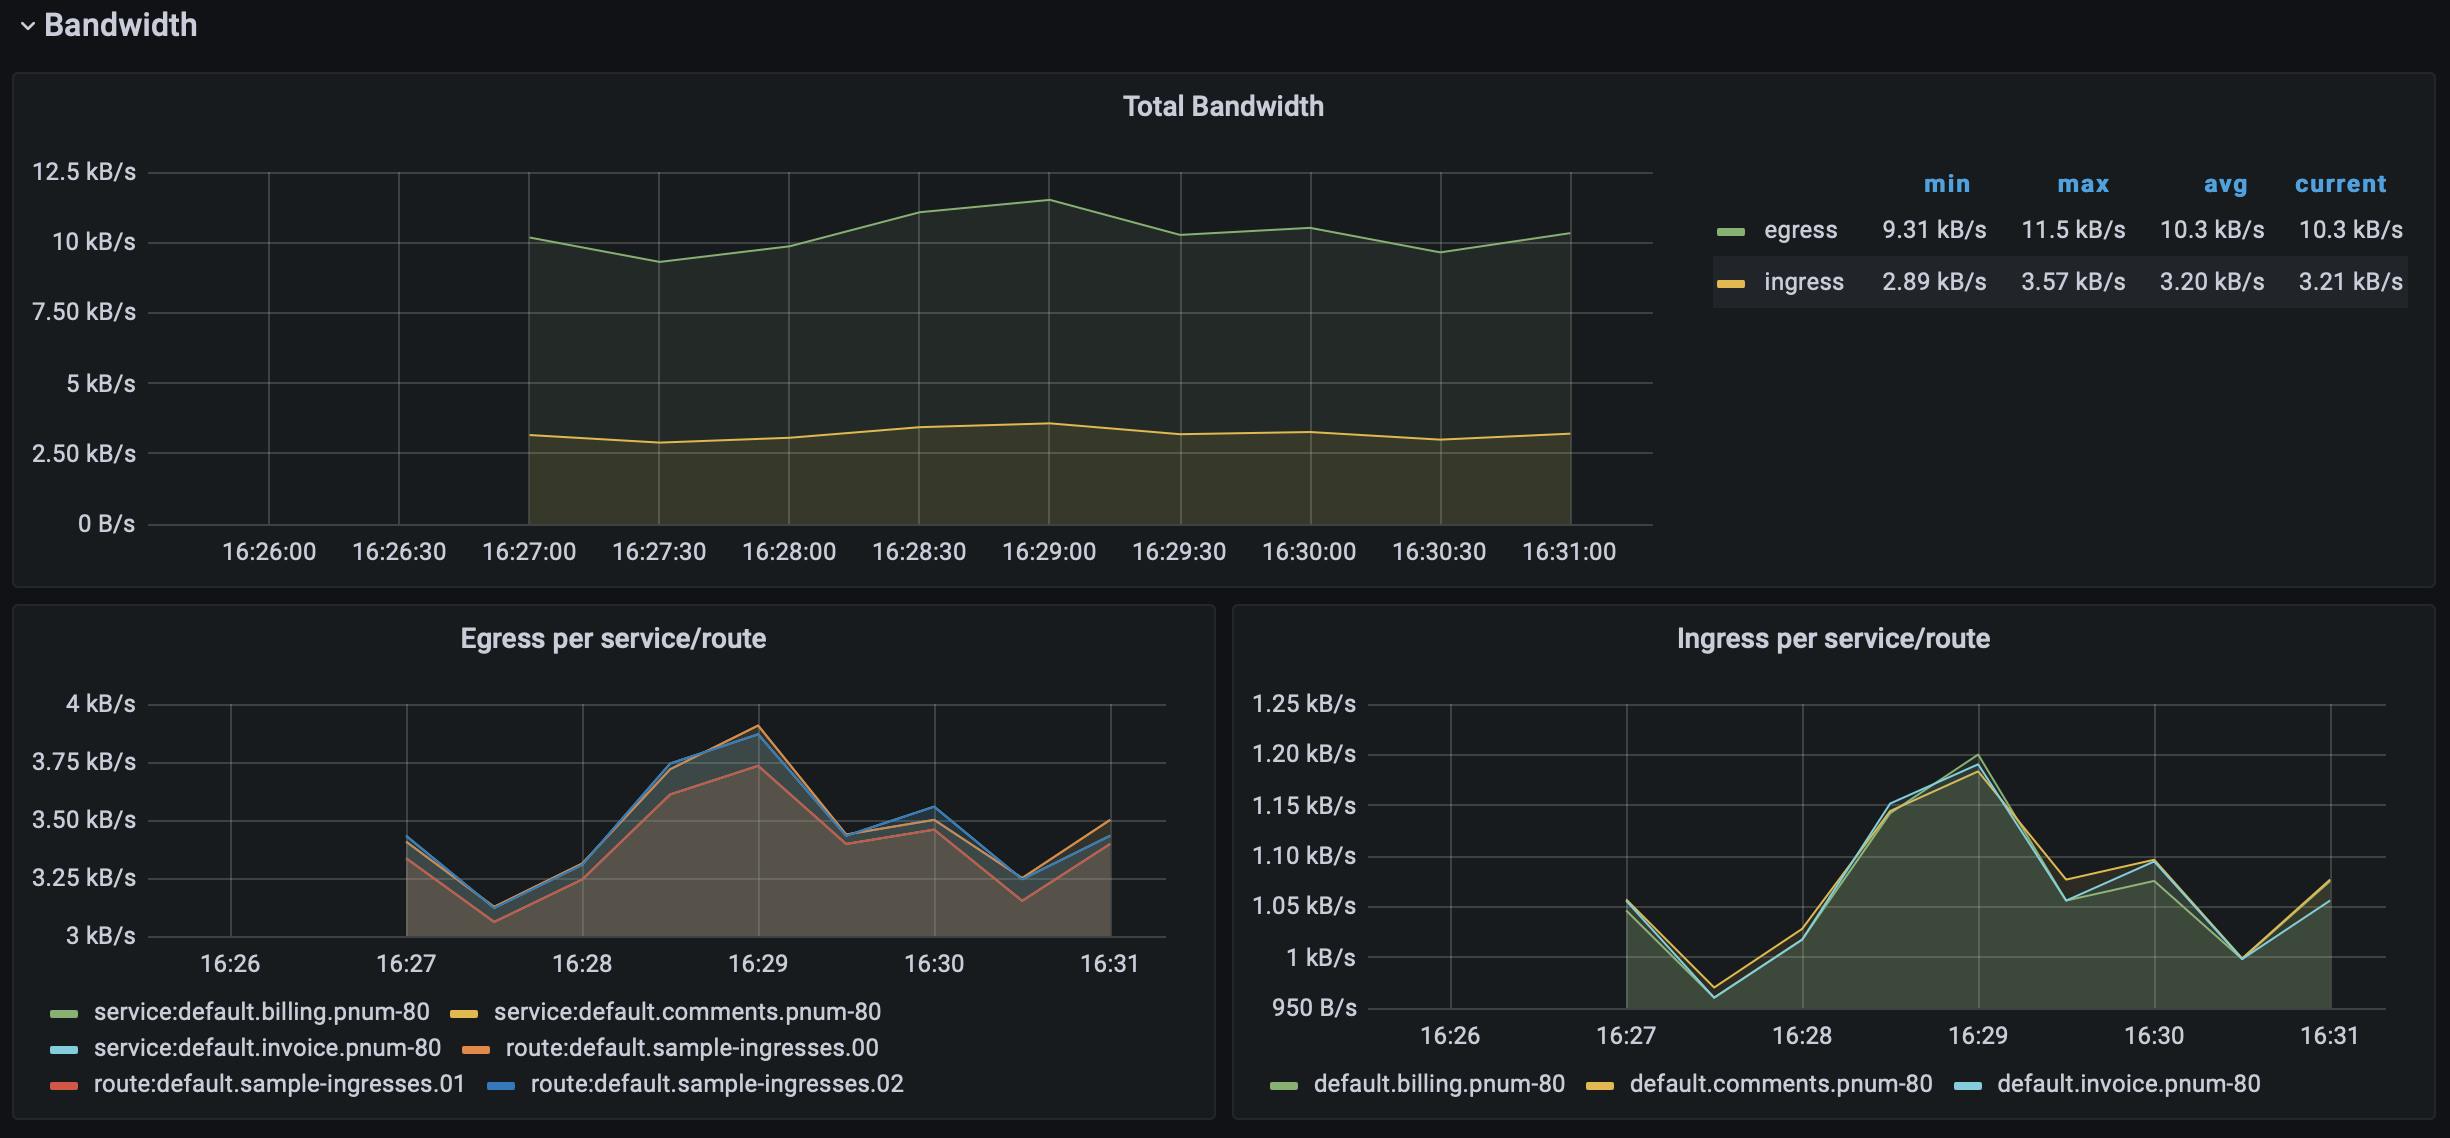
After letting your traffic simulation run for just a few minutes, return to your Grafana instance in your browser ([http://localhost:3000](http://localhost:3000)http://localhost:3000) and zoom in on the last few minutes of activity. You should see lots of beautiful visualizations ready for your analysis, with just a little bit of Kubernetes know-how.
## **Conclusion**
If you've been following along, now you're free to play around with all the out-of-the-box monitoring solutions. You can even introduce new Prometheus metrics in your instance or create Grafana dashboards of your own. Since this is a custom installation of these powerful tools, there is no limit to what you can accomplish with your new APM stack.
When you finish the experiments, cleanup is simple:
- Give your while loop a Ctrl+C to terminate it.
- Shut down your port forwarding processes.
- Run kind delete cluster –name kong to terminate your cluster.
**Once you've finished this Prometheus and Grafana on Kubernetes Ingress tutorial, you may find these other Kubernetes tutorials helpful:**
As Kubernetes has become the de facto orchestration platform for deploying cloud native applications , networking and traffic management have emerged as pivotal challenges when managing access to services and infrastructure. The core Kubernetes Ing
Peter Barnard
# Kubernetes Ingress gRPC Example With a Dune Quote Service
APIs come in all different shapes and forms. In this tutorial, I'll show you a K8s Ingress gRPC example. I’ll explain how to deploy a gRPC service to Kubernetes and provide external access to the service using Kong's Kubernetes Ingress Controller.
Viktor Gamov
# Managing Docker Apps With Kubernetes Ingress Controller
Think back to when your development team made the switch to Dockerized containers. What was once an application requiring multiple services on virtual machines transitioned to an application consisting of multiple, tidy Docker containers. While the
Alvin Lee
# Using Kong Kubernetes Ingress Controller as an API Gateway
In this first section, I'll provide a quick overview of the business case and the tools you can use to create a Kubernetes ingress API gateway. If you're already familiar, you could skip ahead to the tutorial section or watch the video at the bott
Viktor Gamov
# A Unified Gateway for APIs + Agentic Applications on VMware VKS with Kong Konnect
Built on top of Kong API Gateway, the Kong AI Gateway is designed to address key challenges in enterprise AI adoption. Modern AI applications rarely rely on a single model; instead, they orchestrate multiple GenAI providers, agent frameworks, Age
Anika Suri
# What's the Difference: Kubernetes Controllers vs Operators?
Kubernetes, or K8s, is one of the most powerful open source container orchestration systems — especially for its automatic implementation of a desired state. In other words, as an admin, you get to specify how you want your application and cluster t
Kong Ingress Controller 3.1 provides brand-new capabilities for keeping your secrets secure. We’ve introduced new KongVault and KongLicense CRDs, and added a way to keep sensitive information in your cluster when using KIC in Konnect. Finally, t
Michael Heap
# Gateway API vs Ingress: The Future of Kubernetes Networking
As Kubernetes has become the de facto orchestration platform for deploying cloud native applications , networking and traffic management have emerged as pivotal challenges when managing access to services and infrastructure. The core Kubernetes Ing
Peter Barnard
# Kubernetes Ingress gRPC Example With a Dune Quote Service
APIs come in all different shapes and forms. In this tutorial, I'll show you a K8s Ingress gRPC example. I’ll explain how to deploy a gRPC service to Kubernetes and provide external access to the service using Kong's Kubernetes Ingress Controller.
Viktor Gamov
# Managing Docker Apps With Kubernetes Ingress Controller
Think back to when your development team made the switch to Dockerized containers. What was once an application requiring multiple services on virtual machines transitioned to an application consisting of multiple, tidy Docker containers. While the
Alvin Lee
# Using Kong Kubernetes Ingress Controller as an API Gateway
In this first section, I'll provide a quick overview of the business case and the tools you can use to create a Kubernetes ingress API gateway. If you're already familiar, you could skip ahead to the tutorial section or watch the video at the bott
Viktor Gamov
# A Unified Gateway for APIs + Agentic Applications on VMware VKS with Kong Konnect
Built on top of Kong API Gateway, the Kong AI Gateway is designed to address key challenges in enterprise AI adoption. Modern AI applications rarely rely on a single model; instead, they orchestrate multiple GenAI providers, agent frameworks, Age
Anika Suri
# What's the Difference: Kubernetes Controllers vs Operators?
Kubernetes, or K8s, is one of the most powerful open source container orchestration systems — especially for its automatic implementation of a desired state. In other words, as an admin, you get to specify how you want your application and cluster t
Kong Ingress Controller 3.1 provides brand-new capabilities for keeping your secrets secure. We’ve introduced new KongVault and KongLicense CRDs, and added a way to keep sensitive information in your cluster when using KIC in Konnect. Finally, t
Michael Heap
## Ready to see Kong in action?
Get a personalized walkthrough of Kong's platform tailored to your architecture, use cases, and scale requirements.