## API gateways and novel use of distributed tracing
API gateways play a crucial role in distributed tracing, especially in large-scale cloud-native applications. As the entry point for most client requests, the API gateway is often the first system to receive and process an incoming request. In many cases, the full context of the request is only captured at this stage.
For effective observability, it's essential to start a trace and assign a traceID right at the API gateway. Once the traceID is assigned, along with an API identifier, all downstream activities and interactions of that request can be tracked and linked back to the initial point of entry into the system. This ensures that the entire journey of the request, from start to finish, is captured in a single, cohesive trace.
In large companies with hundreds of microservices, distributed tracing is a foundational part of the infrastructure for tracking performance and optimizing system reliability. But beyond tracing, the concept of context propagation has emerged as a powerful tool that extends its benefits to many other areas of application development.
**Context propagation** refers to the ability to inject metadata into a request, which is then carried across various systems (e.g., message queues, stream processing, API calls) or protocols (such as gRPC or HTTP). As the request moves through the system, each service or component adds its own additional context to the metadata, allowing the entire journey of the request to be understood in a more nuanced way.
This capability has led to a variety of new use cases, including:
- - **End-to-end (E2E) testing**: By tagging incoming requests with an "E2E test" marker in the context propagation baggage, different systems can handle these requests in special ways. For example, some services may respond with mock data, prevent unintended side effects, or apply special processing logic. This makes it possible to run comprehensive E2E tests across your entire stack, simulating real-world conditions without affecting production systems.
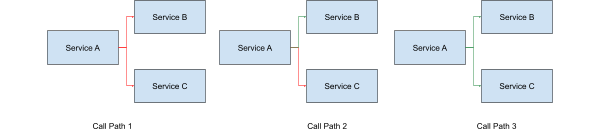
- - **Routing delegates**: If your microservices architecture needs to route traffic differently based on specific attributes of the customer — such as geographic location, customer type, or other demographic factors — you can inject this information into the telemetry baggage. This allows the system to dynamically route requests to different environments or clusters based on the context, providing more tailored processing paths for different segments of your user base.
The ability to propagate context throughout your entire system opens up a wide range of possibilities for more intelligent and efficient system behavior. As the technology continues to evolve, we’re likely to see even more innovative applications of context propagation across various domains.
## A powerful evolution to include logs and metrics
When distributed tracing first emerged, the primary focus was on tracking request flow and measuring latency through the software stack. Over time, however, the industry recognized that combining tracing with logging and metrics significantly enhances observability. When a traced request is identified as slow or underperforming, the next logical step is to dive deeper into debugging the root cause.
To achieve this, you need to correlate the trace with the relevant logs and metrics generated during the lifecycle of that API request. While **OpenTracing** itself doesn't handle the collection and storage of logs and metrics, it provides the necessary APIs and exporters to integrate important metadata — such as **traceID**, **spanID**, and additional **span attributes** — into other observability dimensions like logs and metrics. This integration allows for more comprehensive insights and faster troubleshooting.
## OpenTelemetry’s role in simplifying instrumentation
Before OpenTelemetry, monitoring and debugging distributed systems required multiple (often incompatible) tools and frameworks. The effort to instrument services was cumbersome and fragmented, especially when integrating different observability solutions for metrics, traces, and logs.
OpenTelemetry solves this problem by providing a single, unified framework for collecting telemetry data, drastically simplifying the instrumentation process. Instead of having to manually configure and manage separate solutions for tracing, logging, and monitoring, OpenTelemetry streamlines the process by providing a cohesive approach that works across multiple services and languages.
### Major components of OpenTelemetry
- - **Vendor-agnostic API**: A specification in multiple programming languages that provides standardized interfaces for emitting telemetry data, making it easy to instrument applications regardless of the vendor or underlying platform.
- - **SDK (software development kit)**: A set of libraries and tools that implement the vendor-agnostic API in various languages, allowing developers to easily integrate telemetry data collection into their code.
- - **Collectors**: A vendor-neutral component that acts as a proxy to receive, process, and export telemetry data. Collectors can accept data in various formats — such as OTLP, Jaeger, Prometheus, and others — and can send this data to multiple backend observability systems for further analysis.
- - **Exporters**: Components that transmit telemetry data from the collector to backend systems such as Jaeger, Zipkin, Prometheus, or other vendor-specific observability platforms, enabling centralized monitoring and analysis.
### Interoperability and ecosystem growth
A key benefit of OpenTelemetry is its ability to integrate with a wide range of observability tools. Since it's designed to be vendor-agnostic, it allows organizations to use their preferred backends for analysis and visualization. Whether you’re using Prometheus for metrics, Jaeger for tracing, or **Elasticsearch** for logs, OpenTelemetry can export your data to any of these systems and more.
The OpenTelemetry project has seen rapid growth and adoption, with major cloud-native platforms like Kubernetes and cloud providers like AWS, Google Cloud, and Microsoft Azure offering support for OpenTelemetry-based instrumentation. As the ecosystem continues to expand, more integrations and out-of-the-box solutions are becoming available, further cementing OpenTelemetry’s place as the go-to observability framework for modern applications.
### Industry adoption
Since its introduction, OpenTelemetry has quickly gained adoption across industries, from small startups to large enterprises. Companies building cloud-native applications recognize the value of having a standardized approach to observability, and OpenTelemetry offers just that.
By adopting OpenTelemetry, organizations can gain better insights into the performance and health of their microservices architectures, leading to faster troubleshooting, improved system reliability, and better user experiences.
### Conclusion
As distributed systems continue to evolve, the need for robust observability tools is more critical than ever. OpenTelemetry stands at the forefront of this shift, offering a powerful, open-source framework that simplifies instrumentation and enhances interoperability across the entire observability stack. By adopting OpenTelemetry, organizations can gain deep insights into their applications, troubleshoot issues faster, and ensure systems run smoothly in production.
If you’re looking to future-proof your observability strategy, OpenTelemetry is the framework you need to explore.
### About the Author
[Madan Thangavelu](https://www.linkedin.com/in/madanthangavelu/)Madan Thangavelu is a Kong Champion and Sr. Director of Engineering at Uber, with over 15 years in the software industry and extensive experience across fintech, mobile security, and large-scale consumer applications. Madan founded Uber’s API platform, processing millions of concurrent trips worldwide. In his current role, he leads the development of the flagship Uber Rider app and oversees major business platforms including fulfillment, fares, and API frameworks. "As the engineering lead for API platforms at Uber, I enjoy sharing our learnings with the API community. Kong has a fantastic community that can benefit from such information."
*Interested in becoming a Kong Champion or learning more about the program? Visit the *[*Kong Champions page*](https://konghq.com/community/kong-champions)*Kong Champions page**.*