Once you've downloaded Kuma, you should have access to kumactl, which is the built-in CLI that Kuma provides on every download. I also recommend having an empty Kubernetes cluster running on minikube.
## **Install Kuma**
Kuma supports [many installation methods](https://kuma.io/install)many installation methods on both Kubernetes, VMs and other environments. In this tutorial, we will use kumactl to install the Kuma control plane. You can then pipe this information inside of Kubernetes. By doing that, you're effectively installing the control plane. Out of the box, this will create a new namespace in Kubernetes called kuma-system. Within my example kuma-system namespace, I have one service and one part that’s the control plane.
Kuma supports [Envoy](https://www.envoyproxy.io)Envoy as the data plane proxy technology, but it doesn't require Envoy expertise. Kuma abstracts away all the most common use cases into native policies that you can use. If there is a policy that Kuma doesn't support natively, then you can use the proxy template policy to go low level and change the underlying Envoy configuration. So if there is something that Envoy can do, but Kuma does not fit in a native policy, that means that you can still have access to the entire Envoy ecosystem by using the proxy template configuration.
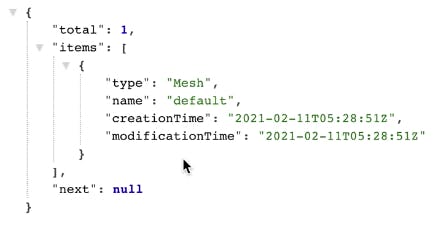
Kuma also exposes an [HTTP API](https://kuma.io/docs/1.0.8/documentation/http-api)HTTP API, which you can use to explore the state of the resources, including all the meshes that you have running on the system. Kuma is a multi mesh support system. That means your company can have one deployment of Kuma and as many compartmentalized meshes as you want.
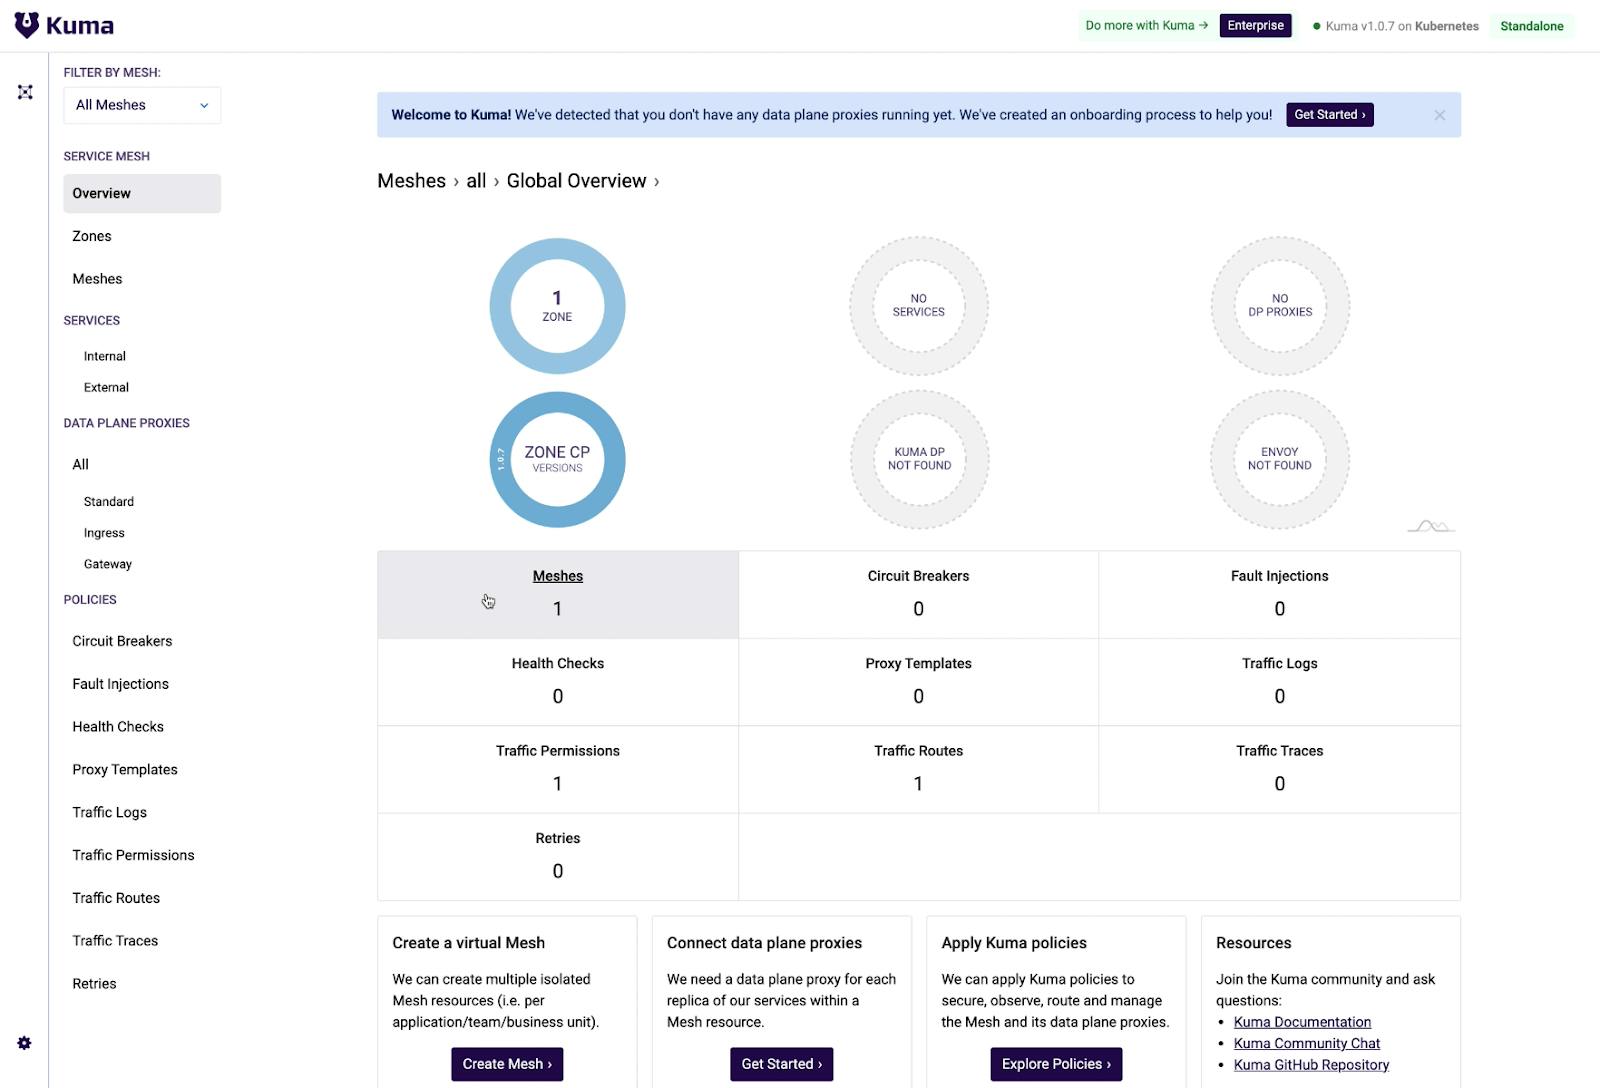
If you go to http://localhost:5681/gui, you can see the GUI that comes out of the box with Kuma. This GUI is on top of the same HTTP API mentioned above.
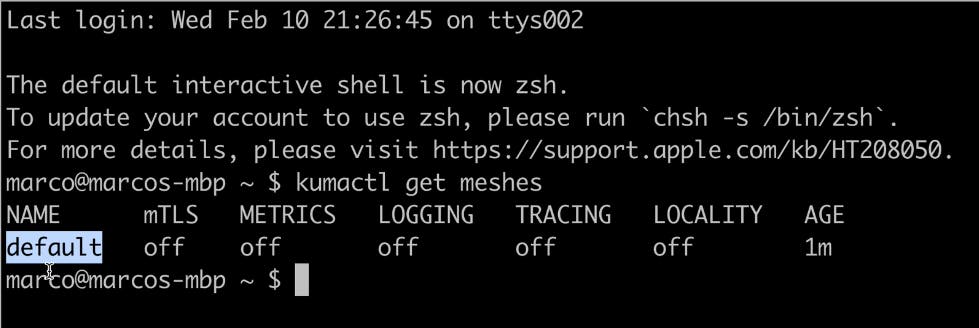
You can also use the kumactl CLI to explore the status of the resources. kumactl consumes that same HTTP API to retrieve this information.
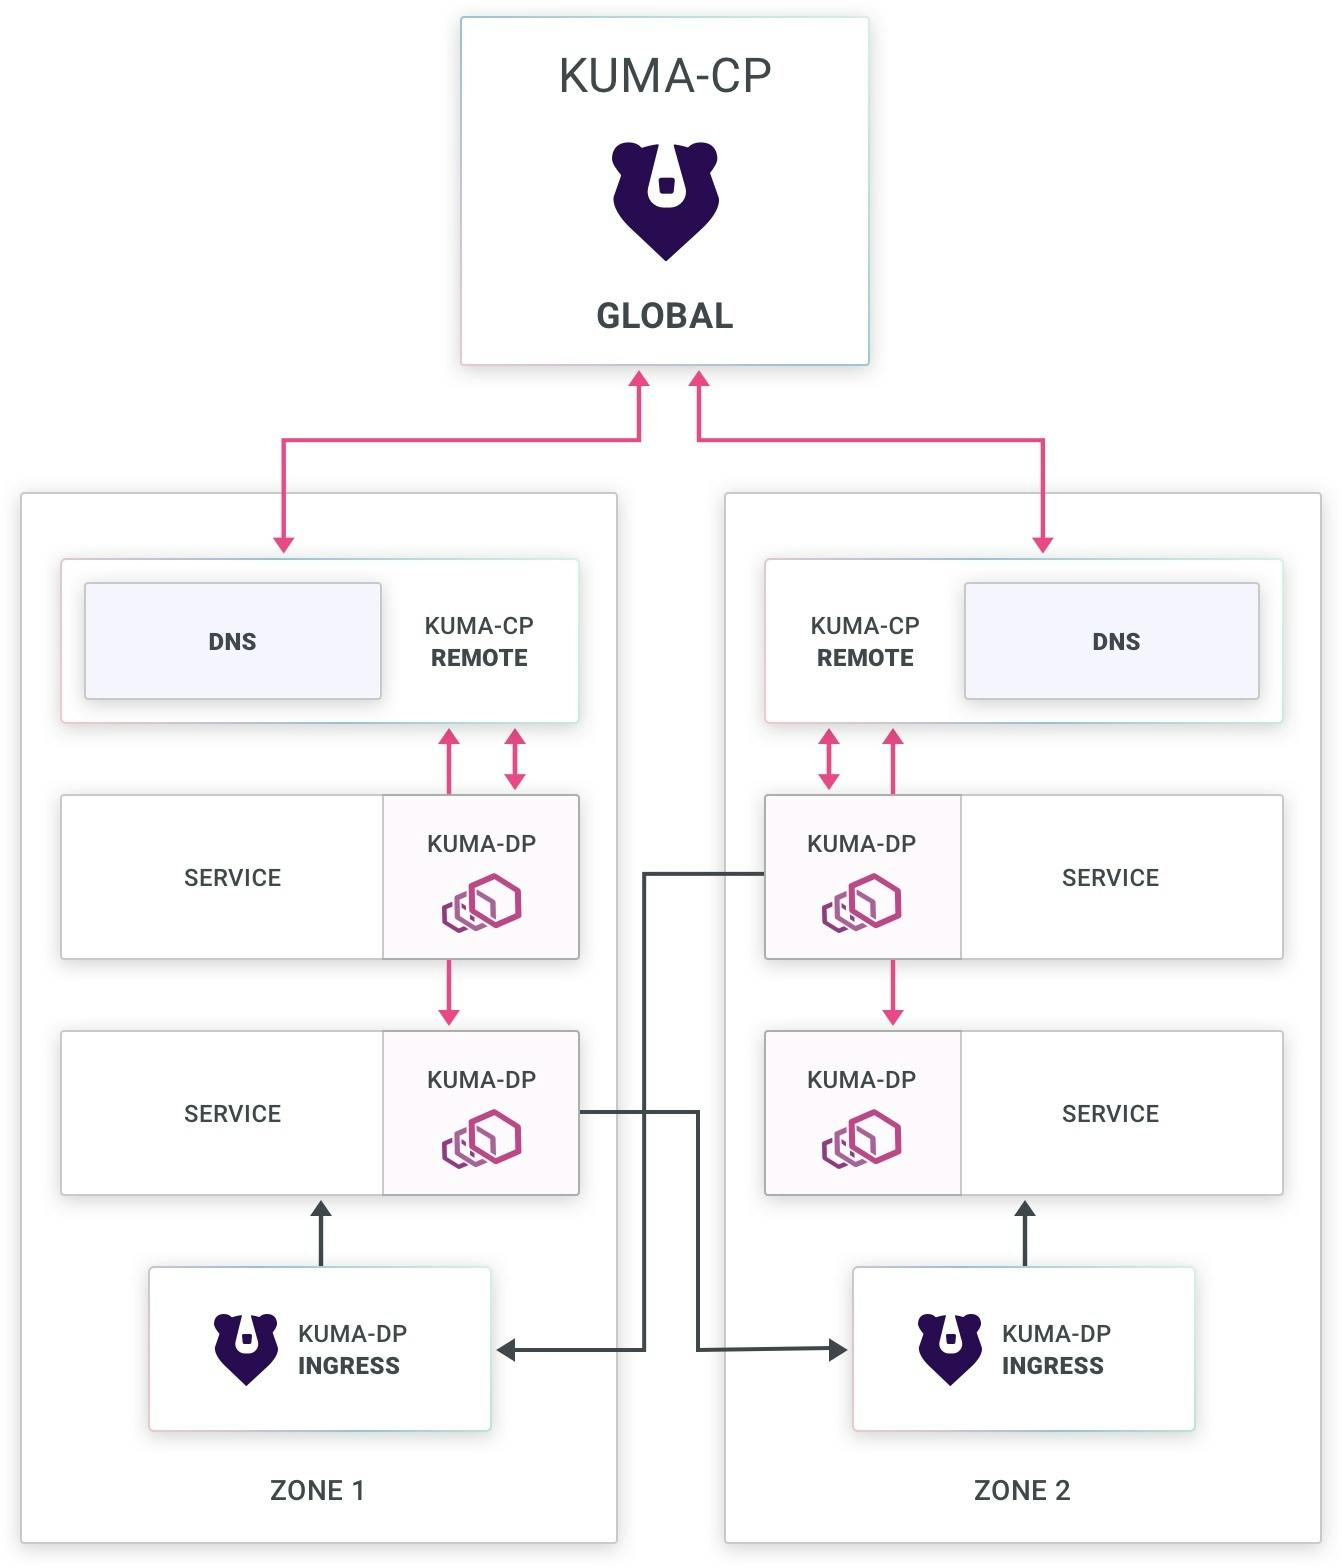
There are many other ways you can deploy Kuma. For example, you can deploy Kuma in a [multi-zone mode](https://kuma.io/docs/1.0.8/deployments/multi-zone)multi-zone mode. With multi-zone mode, you can support multiple zones that are either Kubernetes or VM environments within one cluster. You can also have hybrid multi-cloud containers and virtual machines.
Go ahead and install your application. Whenever you create a service in Kuma, you can annotate the namespace to instruct Kuma to inject the sidecar proxy automatically.
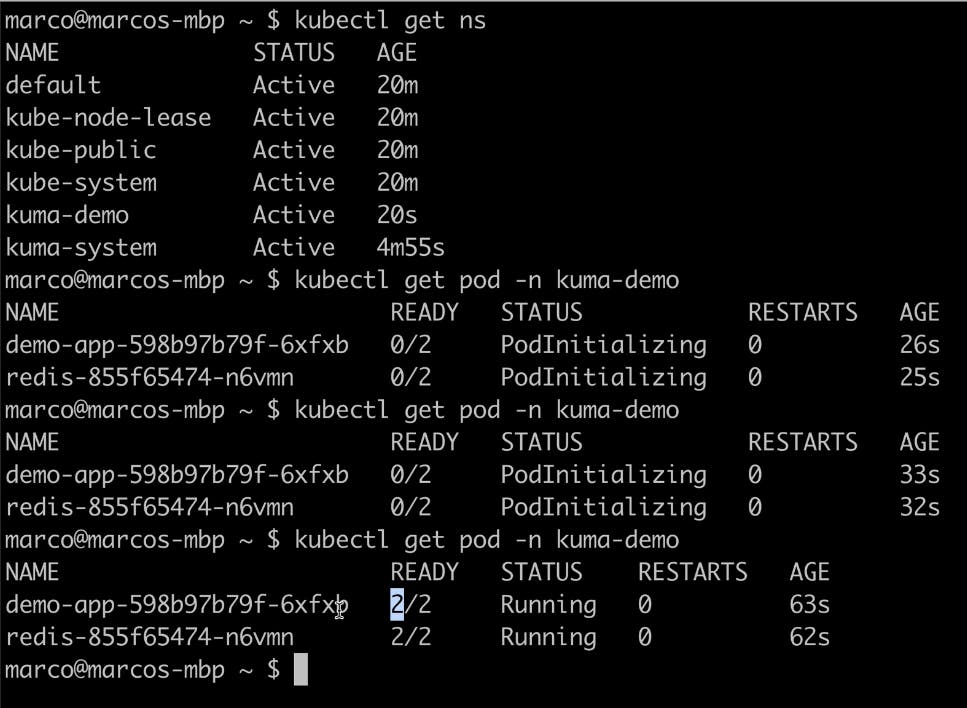
When you check out your Kubernetes namespaces, you should see the new app.
You should start to see your data plane proxy coming in the GUI, but they'll still be offline. That's because your services are not ready. Kuma will check the status of the underlying service and the status of Envoy. Kuma has deep status checking so that the system shows where things went wrong, when and if they go wrong.
Your pods should be initialized now.
In my example, I have two containers per pod. One of them is the Envoy sidecar injection.
If you refresh the GUI, you should see data plane proxies coming online.
## **Set Up Data Plane Proxies**
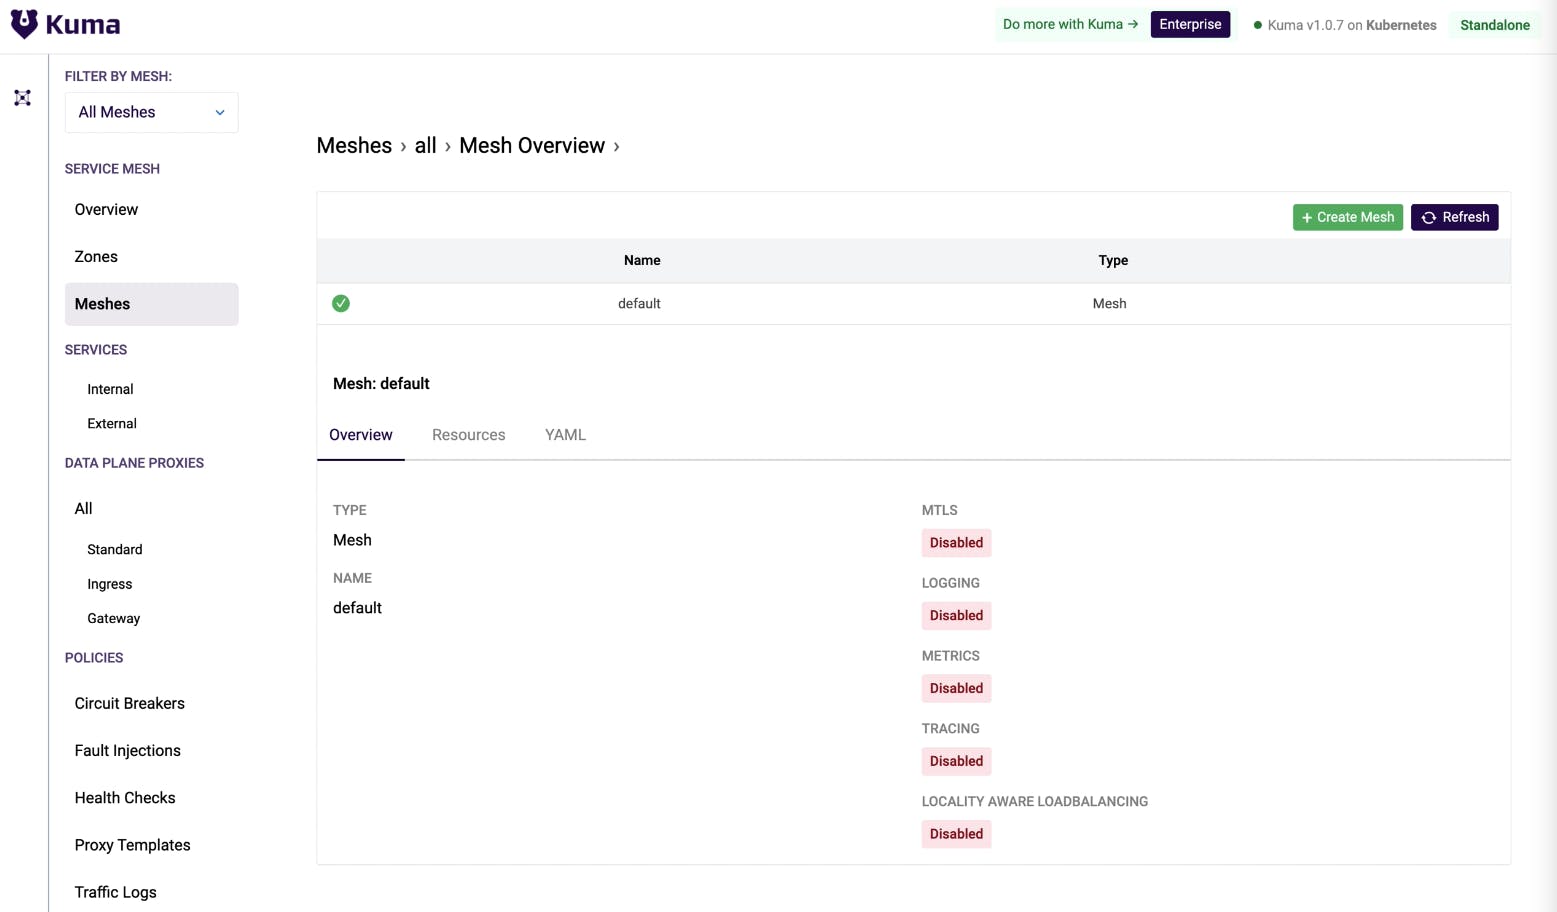
In the GUI, you can explore how many meshes you have. In my example, there is only one, and it’s a default mesh. Everything is disabled. There are no data plane proxies whatsoever.
With Kuma, you can tag your workloads with custom tags. You can use these tags in your policies to select service mesh behavior.
If you look at your internal services, you should see a demo app service, a data plane proxy and a Redis service.
Next, you can expose your demo application on port 5000.
And if I load port 5000 for my example, I can see my demo app. I can automatically generate some traffic so that I'll see some results immediately if I disrupt this traffic.
The traffic is working because, by default, Kuma has traffic permissions that enable all traffic from every source to every destination.
You can choose a different certificate authority (CA). Kuma provides a built-in CA, but you can choose to provide your own CA as well. In my example on Kubernetes, I'm using kubectl to apply a new resource on my default mesh to enable mTLS with a built-in backend, automatically creating the CA. Then, I instructed Kuma to rotate the data plane proxy certificates every day automatically.
After applying just one policy, out of the box, Kuma was able to provision the CA and rotate the certificates. Even if you have hundreds of thousands of data planes across multiple services, this is how easy it is to use zero-trust security with Kuma.
On Kubernetes, you can use kubectl. But of course, because Kuma also supports virtual machines, you can again run it on a universal mode. To run it in universal mode, you'll just need to apply a simple YAML declarative config with kumactl. Since I'm running on Kubernetes for this example, I'll pull up my editor and echo this policy into. I'll copy and paste it into my terminal to enable mTLS.
All you need to do is to apply this configuration. After refreshing, you'll see that mTLS enabled on your default mesh.
## **Edit Traffic Permissions**
As I mentioned earlier, the counters increase because Kuma enables [traffic permissions](https://kuma.io/docs/1.0.8/policies/traffic-permissions)traffic permissions out of the box, but that doesn’t have to be the case. Traffic permissions allow you to determine which service can consume what within the mesh. If you delete those traffic permissions from your mesh, this traffic will stop working automatically.
For traffic to work again, you must re-enable that traffic in your traffic permissions. In my example, I can do that by creating my command and applying it inside of kubectl.
After that, you should see your traffic automatically restored.
## **Enable Observability With Prometheus and Grafana**
To do that, install Prometheus and Grafana from Kuma out of the box using kumactl install metrics. Once you install them, the system will create a new namespace in Kubernetes called Kuma Metrics.
As this installs, you'll see the services pop up in your Kuma GUI in such a way that you can identify all the services that you're running and all the associated data plane proxies.
## **Traffic Metrics Policy**
Next, you can look at your [traffic metrics](https://kuma.io/docs/1.0.8/policies/traffic-metrics)traffic metrics policy, enabling you to enable automatic collection of your metrics within Kuma. Start by adding a new metrics entry to enable metrics. Update the policy in your kubectl configuration. And by going to the meshes again, you'll see that your metrics are enabled.
Now that your metrics are enabled, you can visualize them. Kuma comes with Granfana dashboards out of the box that you can use to visualize the traffic. Export Grafana and expose it so that you can start accessing it in the Kuma metrics namespace using port 3000.
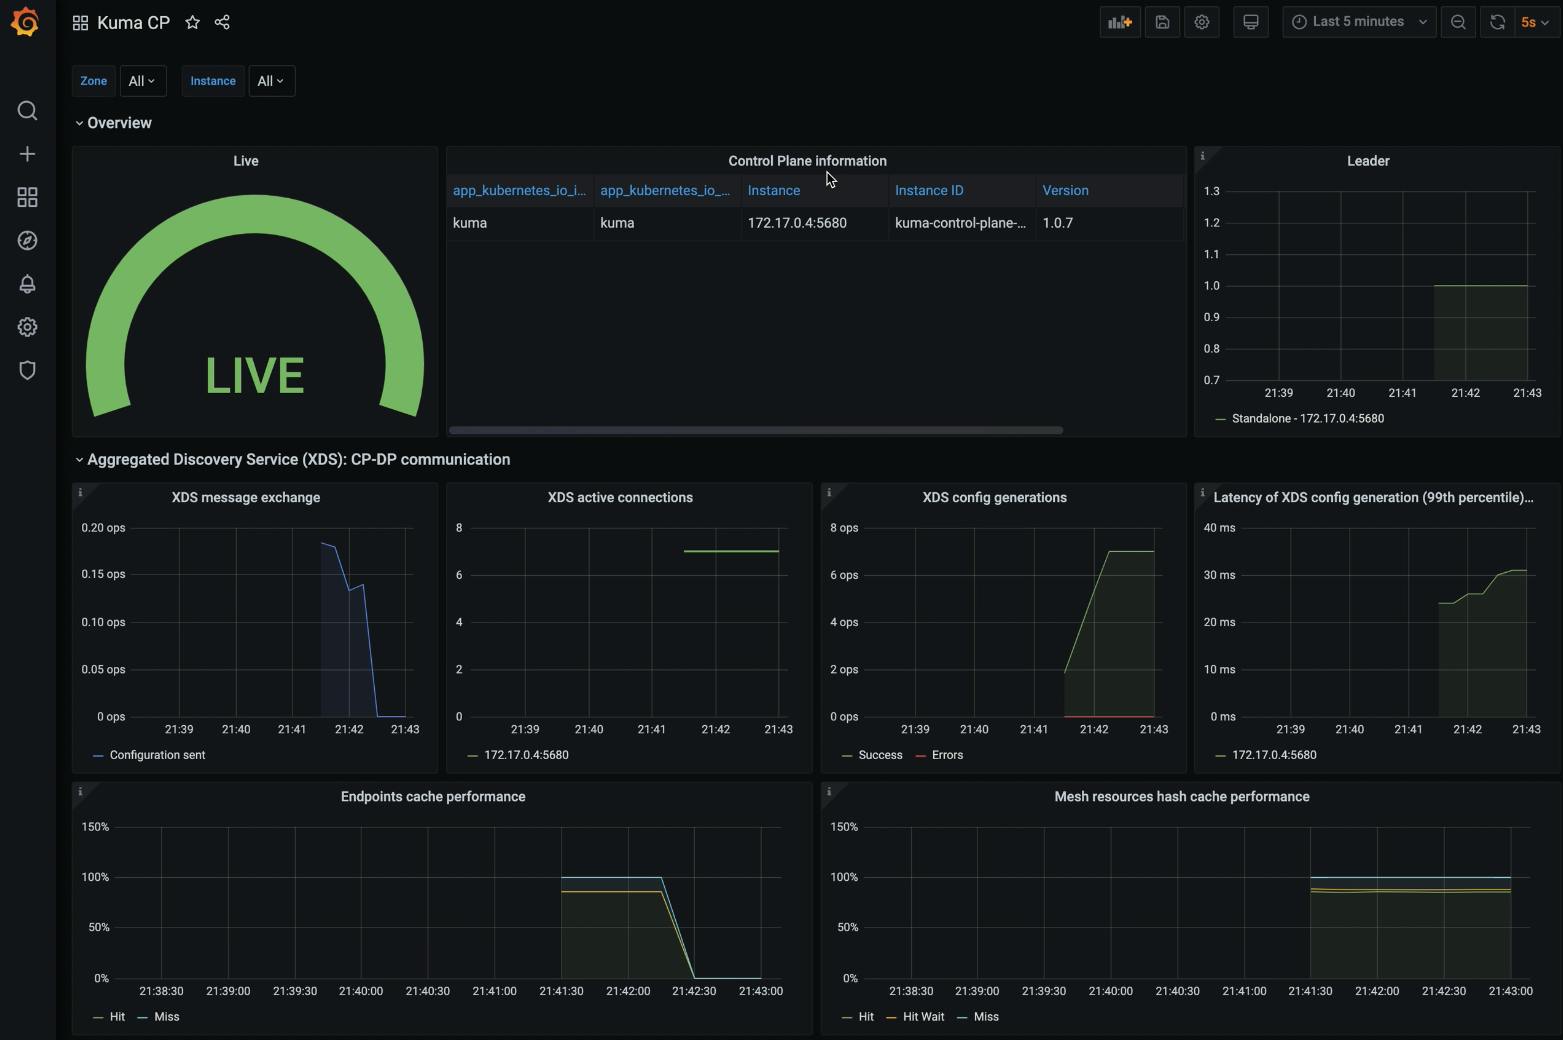
In my example, I can see my mesh's status from the last five minutes and the number of data planes. I can see the bytes flowing through Envoy.
You can then take a look at your service to service traffic. In my example, I'm looking at the traffic from my demo application frontend into my Redis service.
You can also take a look at each data plane. Redis received a lot of requests.
Kuma CP allows you to visualize the actual status of the service mesh, including how long it’s going to take for the control plane to create the XDS configuration for Envoy. You can even measure the performance itself of your service mesh.
## **Happy Meshing!**
In 10 minutes, I installed Kuma, installed the demo app, enabled zero-trust security, enabled and installed Grafana and Prometheus, and enabled observability.
### ***Easily Include Other Development Teams***
If you have other teams using your service mesh and want to provision them a compartmentalized mesh, Kuma can do that.
To set this up, go to the policies. There you can explore the mesh policies. Within the mesh policies, you can provision as many service meshes as you want on top of one deployment of Kuma. It's a multi-tenant system.
Once you create a new service mesh, it will show up in your Kuma GUI.
It's simple to use Kuma to provision as many service meshes as you want for your teams.
You can also explore the enterprise offerings, such as [Kong Mesh](https://konghq.com/kong-mesh)Kong Mesh. These offerings will provide you with a list of products that expand and innovate on top of Kuma to address any enterprise requirement you may have.
In the rapidly evolving world of microservices and cloud-native applications , service mesh has emerged as a critical tool for managing complex, distributed systems. As organizations increasingly adopt microservices architectures, they face new c
The acceleration of microservices and containerized workloads has revolutionized software delivery at scale. However, these distributed architectures also introduce significant complexity around networking, security, and observability. As developmen
By now, when we hear the words "service mesh" we typically know what to expect: service discovery, load balancing, traffic management and routing, security, observability, and resilience. So, why Kong Mesh? What does Kong Mesh offer that would be mo
At first glance, that does not make sense, right? The title suggests you should invest your DevOps/Platform team’s time in introducing a new product that most likely will:
increase the complexity of your platform
increase resource usage
in
Kuma is configurable through policies. These enable users to configure their service mesh with retries, timeouts, observability, and more.
Policies contain three main pieces of information:
Which proxies are being configured
What traffic for t
As an application developer, have you ever had to troubleshoot an issue that only happens in production? Bugs can occur when your application gets released into the wild, and they can be extremely difficult to debug when you cannot reproduce without
Introduction One of the most common questions I get asked is around the relationship between Kong Gateway and Kuma or Kong Mesh . The linking between these two sets of products is a huge part of the unique “magic” Kong brings to the connectivit