Blog
  • AI Gateway
  • AI Security
  • AIOps
  • API Security
  • API Gateway
    • API Management
    • API Development
    • API Design
    • Automation
    • Service Mesh
    • Insomnia
    • View All Blogs
  1. Home
  2. Blog
  3. Product Releases
  4. Introducing Konnect Debugger: Get Unprecedented API Traffic Visibility
Product Releases
July 22, 2025
4 min read

Introducing Konnect Debugger: Get Unprecedented API Traffic Visibility

Veena Rajarathna
Staff Product Manager, Kong
Garima Gunjan
Engineering Manager, Kong
Helen Tang
Sr. Product Designer, Kong
Topics
Kong KonnectObservabilityPerformance
Share on Social

More on this topic

eBooks

5 Questions To Ask Your API Gateway Vendor

eBooks

Modernizing Applications with Kubernetes Container Orchestration

See Kong in action

Accelerate deployments, reduce vulnerabilities, and gain real-time visibility. 

Get a Demo
Youtube thumbnail

We're excited to announce the general availability of Konnect Debugger, formerly known as Active Tracing during its tech preview phase. This powerful debugging and observability solution in Kong Konnect has evolved from a focused tracing tool into a comprehensive debugging platform.

Konnect Debugger retains all the great capabilities you loved from Active Tracing while expanding to provide unprecedented visibility into API traffic, now combining detailed tracing and comprehensive logging to empower you to optimize performance, troubleshoot issues, and refine your API strategies with confidence.

The need for comprehensive debugging capabilities

Intermittent service issues can be elusive and challenging to understand. To ensure optimal performance and reliability, it’s essential to have a clear view into your service’s behavior. This is where comprehensive observability comes in — providing the ability to understand and contextualize system behavior even in the absence of known issues.

When critical services malfunction, pinpointing the root cause can be daunting. Is it a DNS issue, an upstream service anomaly, undetected failures, or a gateway problem? For platform operation teams, accessing component-level data and detailed logs is crucial for rapid mean time to resolution (MTTR).

However, generating and storing detailed telemetry data and logs continuously may be detrimental to the performance of the service and unnecessary. This is where targeted, on-demand insights become invaluable — enabling teams to swiftly identify and resolve issues, minimizing service disruptions.

From Active Tracing to Konnect Debugger

Building on the foundation of Active Tracing's powerful targeted tracing capabilities, Konnect Debugger represents the natural evolution of our observability offering. All the features you relied on in Active Tracing remain intact and enhanced:

  • Same powerful tracing engine: Generate detailed OpenTelemetry-compatible traces on-demand
  • Familiar sampling capabilities: Target specific services, routes, or requests with expression-based criteria
  • Enhanced visualization: The same intuitive trace viewer you know, now with additional debugging views
  • Zero additional instrumentation: Continue to get deep insights without changing your existing setup

What's new is the expanded scope: Konnect Debugger now combines these proven tracing capabilities with comprehensive logging, giving you a complete debugging solution in a single, integrated interface.

Introducing Konnect Debugger

With Konnect Debugger, infrastructure administrators can initiate targeted debugging sessions in specific API gateway nodes. During a debugging session, the selected gateway generates both detailed OpenTelemetry-compatible traces and comprehensive logs for all requests matching the sampling criteria. The detailed spans and log entries are captured for the entire request/response lifecycle. These traces and logs can be visualized with Konnect’s built-in debugging interface with no additional instrumentation or telemetry tools. Konnect’s Debugger offers exclusive, in-depth insights that can't be replicated by third-party observability tools.

By capturing detailed, component-level telemetry data and logs, platform operations teams can gain a deeper understanding of their services’ performance, dependencies, error conditions and potential bottlenecks. This targeted approach to observability enables teams to optimize their services, reduce uncertainty, and improve overall system reliability.

Key highlights

  • All your favorite Active Tracing features:
    • Debug sessions can be initiated for a service (includes all routes) or per route
    • Traces and logs can be generated for all requests or those matching sampling criteria
    • Sampling criteria can be defined with simple expressions language (ex: http.method == "GET")
    • Trace spans and attributes adhere to OpenTelemetry conventions
    • Sessions are retained in Konnect for up to 7 days
  • Enhanced with comprehensive logging:
    • Comprehensive request/response logs
    • Seamless correlation between traces and logs for comprehensive analysis
    • Enhanced debugging interface with integrated logs view
  • Same powerful visualization, now expanded:
    • Traces and logs can be visualized in Konnect's built-in debugging interface
    • Familiar trace viewer enhanced with additional debugging capabilities

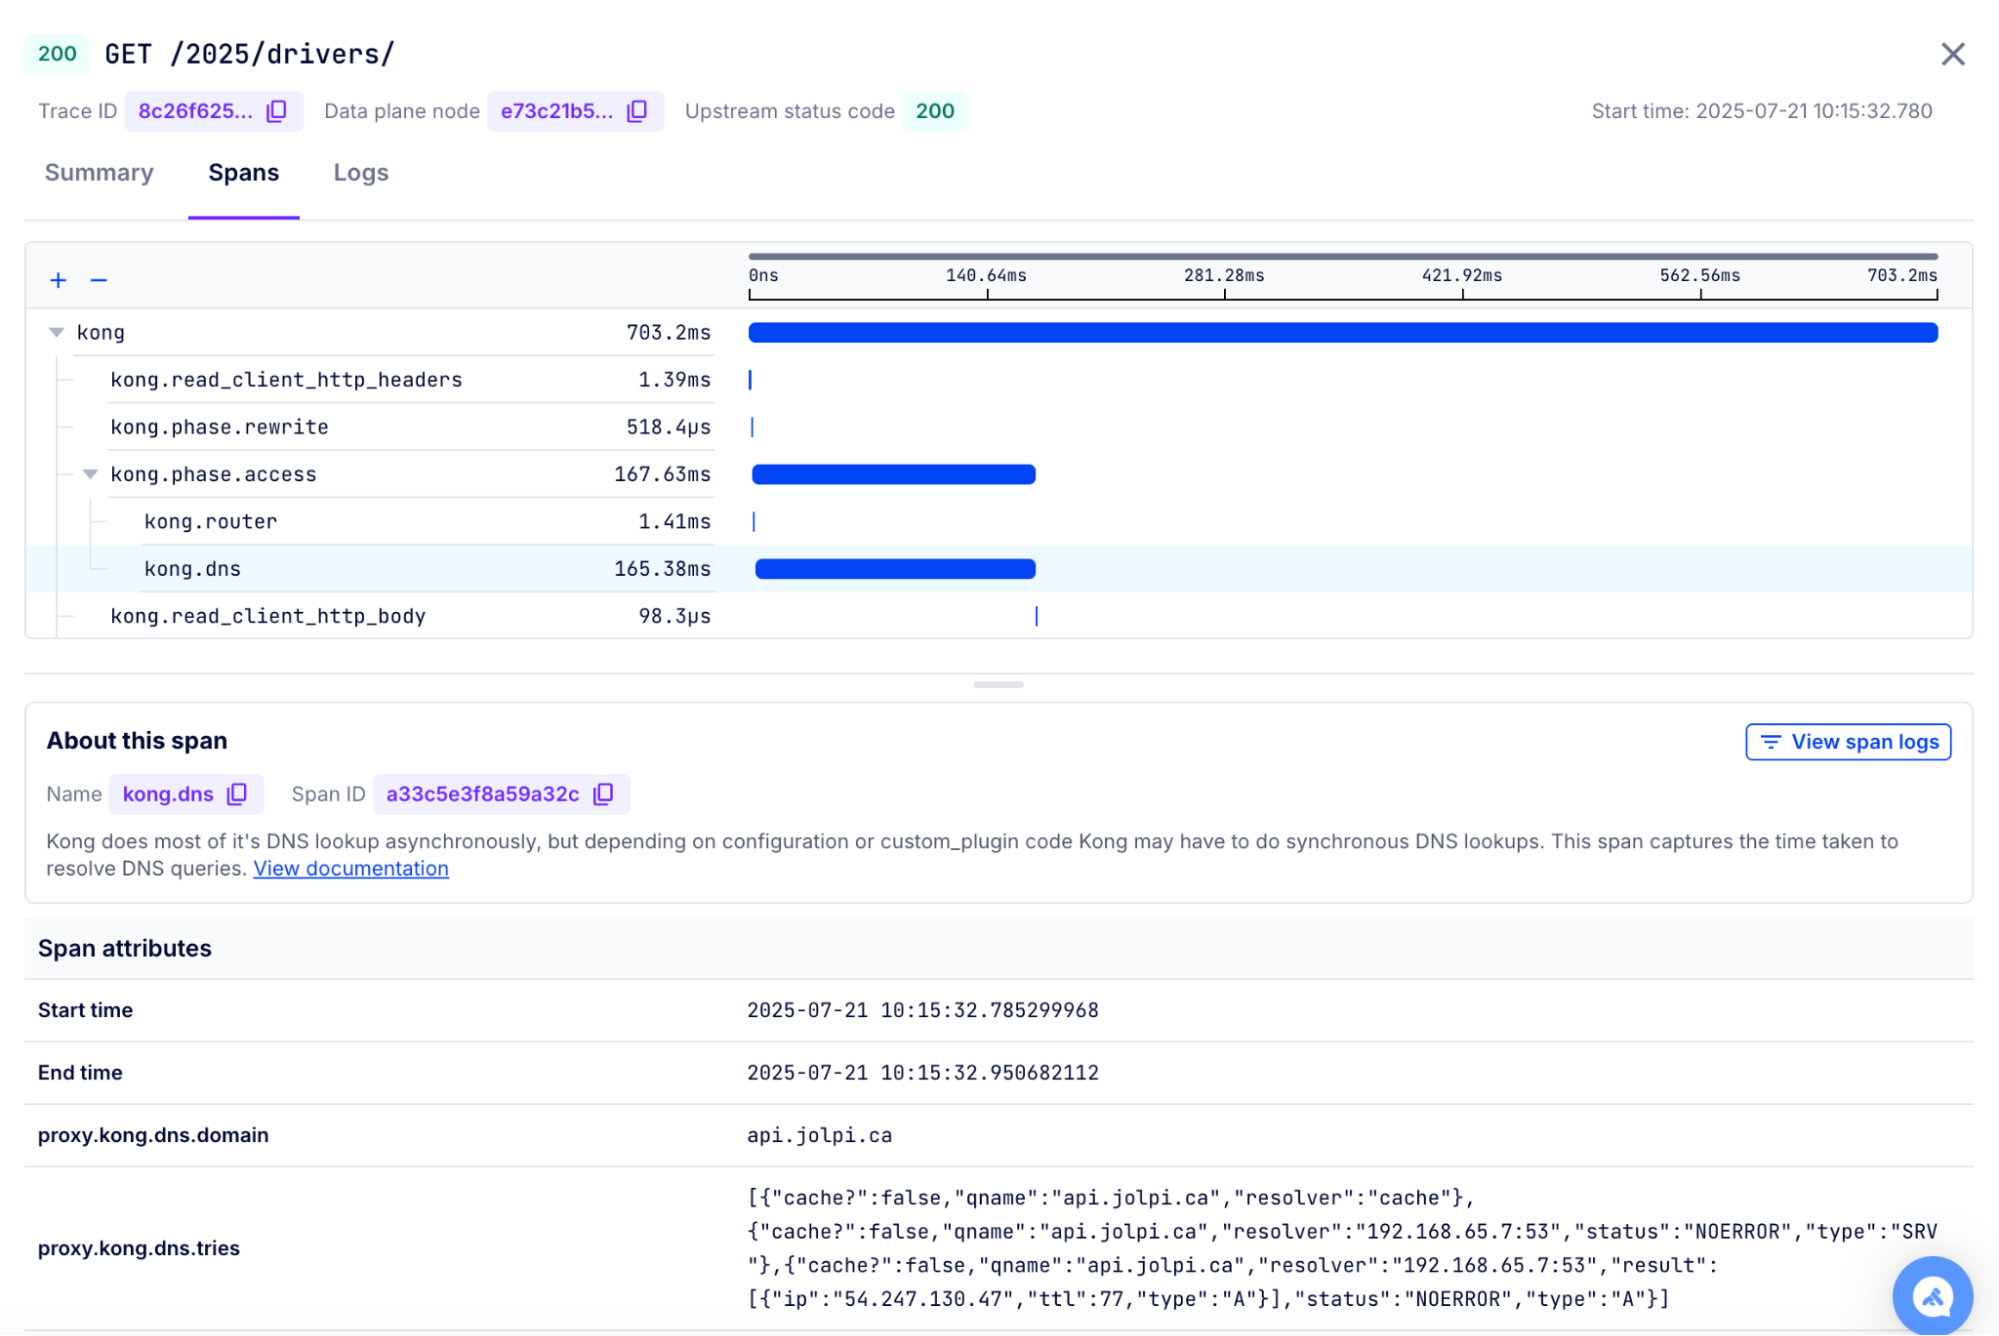
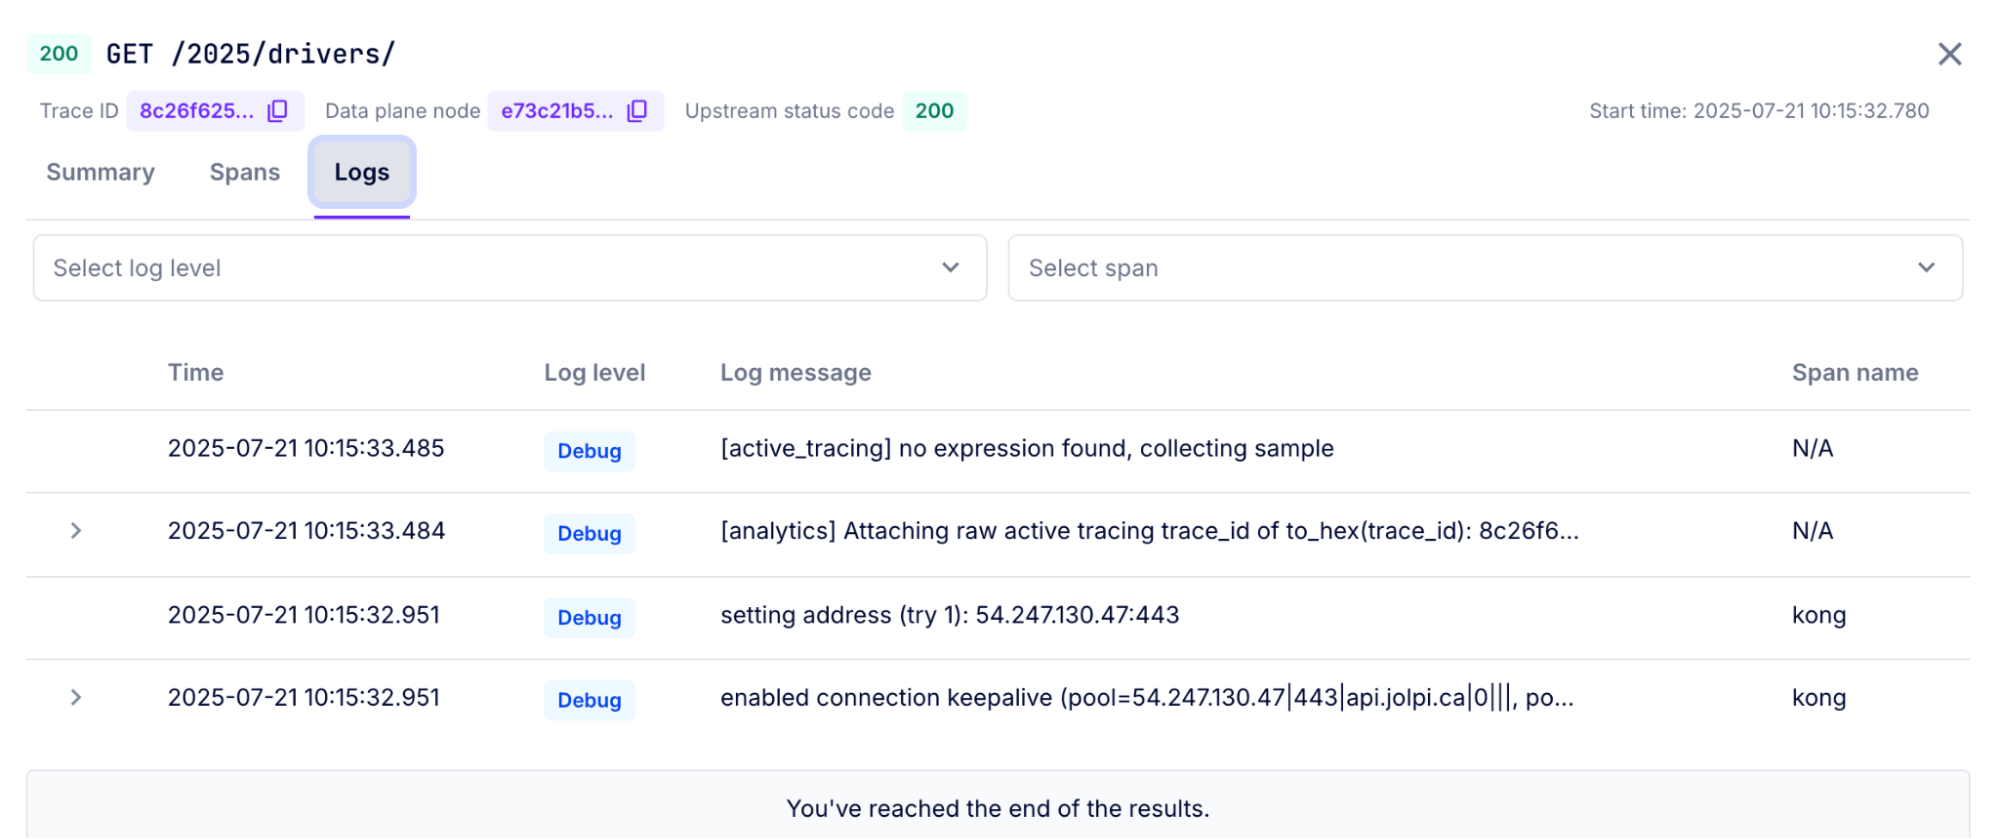
Traces and logs captured in a Konnect Debugger session can be visualized in Konnect's built-in debugging interface. The debugger provides a summary view, trace view, and logs view. You can gain instant insights with the summary view, dive deeper with the trace view, and examine detailed execution logs for comprehensive troubleshooting.

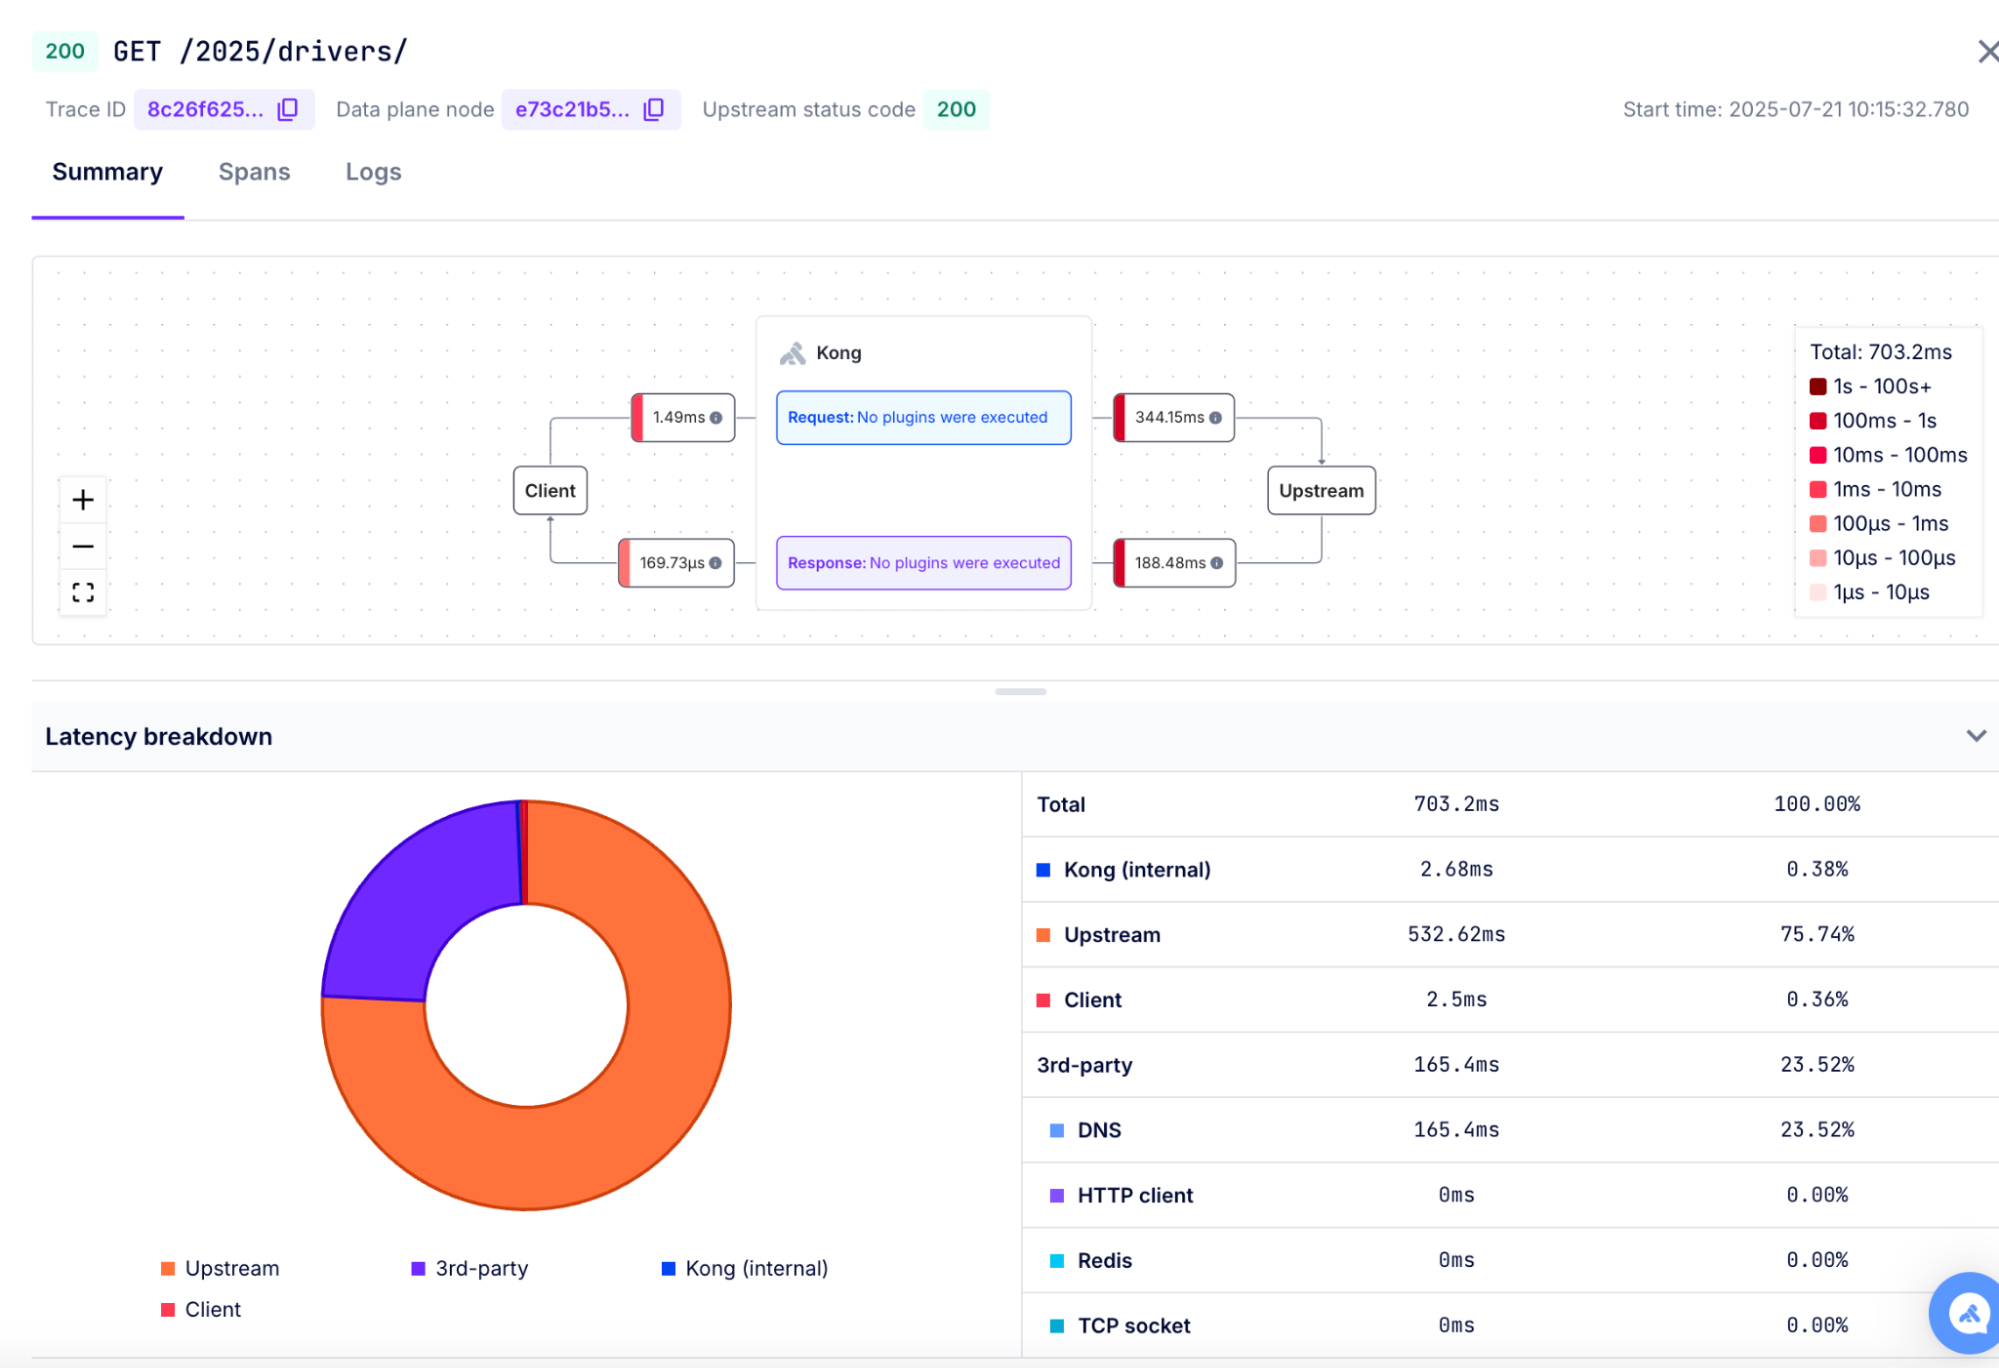
Gain instance insights with summary view

Summary view helps you visualize the entire API request-response flow in a single glance. This view provides a concise overview of critical metrics, error indicators, and a transaction map. The transaction map includes the plugins executed by Kong on both the request and the response, along with the times spent in each phase. Use summary view to quickly understand the end-to-end API flow, identify performance bottlenecks, spot errors, and optimize your API strategy.

Dive deeper with trace view

The trace view gives you unparalleled visibility into Kong's internal workings. This detailed view breaks down into individual spans, providing a comprehensive understanding of:

  • Kong's internal processes and phases
  • Plugin execution and performance
  • Request and Response handling

Use trace view to troubleshoot issues, optimize performance, and refine your configuration with precision.

Examine execution details with logs view

The logs view provides comprehensive logging information captured during the debugging session. This detailed view includes:

  • Plugin execution logs and debug information
  • Error messages
  • Gateway internal processing logs
  • Upstream service communication details

Use logs view to investigate specific execution paths, understand error conditions, and gain detailed insights into request processing behavior.

Get started with Konnect Debugger

We're excited to see how Konnect Debugger will enhance your API operations! Get started with Konnect Debugger today and unlock comprehensive insights into your API traffic.

If you're a Kong Konnect customer, Debugger is now available for your organization. Log in to Konnect, navigate to the gateway manager, select a control plane, and start debugging your APIs with both traces and logs. If you're new to Kong, you can start by signing up for Kong Konnect for free!

Be sure to share your feedback with us. Your input helps us continue to improve this powerful debugging solution.

Unleash the power of APIs with Kong Konnect

Learn MoreGet a Demo
Topics
Kong KonnectObservabilityPerformance
Share on Social
Veena Rajarathna
Staff Product Manager, Kong
Garima Gunjan
Engineering Manager, Kong
Helen Tang
Sr. Product Designer, Kong

Recommended posts

Kong Gateway Enterprise 3.8.x.x EOL

Kong Logo
Product ReleasesSeptember 23, 2025

As of September 2025, Kong Gateway Enterprise 3.8 will enter its End Of Life (EOL) phase and will no longer be fully supported by Kong. Following this, Kong Gateway Enterprise 3.8 will enter a 12-month sunset support period, focused on helping cus

Andrew Jessup

Kong Mesh 2.12: SPIFFE/SPIRE Support and Consistent XDS Resource Names

Kong Logo
Product ReleasesSeptember 18, 2025

We're very excited to announce Kong Mesh 2.12 to the world! Kong Mesh 2.12 delivers two very important features: SPIFFE / SPIRE support, which provides enterprise-class workload identity and trust models for your mesh, as well as a consistent Kuma R

Justin Davies

Unlocking API Analytics for Product Managers

Kong Logo
EngineeringSeptember 9, 2025

Meet Emily. She’s an API product manager at ACME, Inc., an ecommerce company that runs on dozens of APIs. One morning, her team lead asks a simple question: “Who’s our top API consumer, and which of your APIs are causing the most issues right now?”

Christian Heidenreich

Kong Acquires OpenMeter to Bring API and AI Monetization to the Agentic Era

Kong Logo
NewsSeptember 3, 2025

Today, we’re announcing that Kong has acquired  OpenMeter , the open source and SaaS leader for real-time usage metering and billing. OpenMeter’s capabilities will be integrated into Kong Konnect, enabling usage-based pricing, entitlements, and invo

Saju Pillai

Announcing terraform-provider-konnect v3

Kong Logo
Product ReleasesAugust 22, 2025

It’s been almost a year since we released our  Konnect Terraform provider . In that time we’ve seen over 300,000 installs, have 1.7 times as many resources available, and have expanded the provider to include data sources to enable federated managem

Michael Heap

Announcing Kubernetes Ingress Controller 3.5

Kong Logo
Product ReleasesJuly 17, 2025

We're happy to announce the 3.5 release of Kong Ingress Controller (KIC).  This release includes the graduation of combined services to General Availability, support for connection draining, as well as the start of deprecating support for some Ingre

Justin Davies

Kong Gateway Enterprise 3.11 Makes APIs & Event Streams More Powerful

Kong Logo
Product ReleasesJuly 9, 2025

Update Includes Data Orchestration, CyberArk Support, Solace Integration, and Kafka Schema Validation We’re excited to bring you Kong Gateway Enterprise 3.11 with compelling new features to make your APIs and event streams even more powerful, includ

Anthony Gatti

Ready to see Kong in action?

Get a personalized walkthrough of Kong's platform tailored to your architecture, use cases, and scale requirements.

Get a Demo
Powering the API world

Increase developer productivity, security, and performance at scale with the unified platform for API management, AI gateways, service mesh, and ingress controller.

Sign up for Kong newsletter

Platform
Kong KonnectKong GatewayKong AI GatewayKong InsomniaDeveloper PortalGateway ManagerCloud GatewayGet a Demo
Explore More
Open Banking API SolutionsAPI Governance SolutionsIstio API Gateway IntegrationKubernetes API ManagementAPI Gateway: Build vs BuyKong vs PostmanKong vs MuleSoftKong vs Apigee
Documentation
Kong Konnect DocsKong Gateway DocsKong Mesh DocsKong AI GatewayKong Insomnia DocsKong Plugin Hub
Open Source
Kong GatewayKumaInsomniaKong Community
Company
About KongCustomersCareersPressEventsContactPricing
  • Terms•
  • Privacy•
  • Trust and Compliance•
  • © Kong Inc. 2025