They make sense in an API gateway scenario, with a single Kong cluster proxying traffic between consumers and services. Each log line will generally correspond to a request which is "independent" from the rest. However, in more complex scenarios like a service mesh system where a single request can span multiple, internal requests and responses between several entities before the consumer gets an answer, log lines are not "independent" anymore.
-
The format in which log lines are saved are useful for security and compliance as well as to debug certain kinds of problems, but it may not be useful for others. This is because logging plugins tend to store a single log line per request, as unstructured text. Extracting and filtering information from them — for debugging performance problems, for example — can be quite laborious.
It is compatible with both HTTP/HTTPS and stream traffic.
-
Traffic originating from each request is grouped under the "trace" abstraction, even when it travels through several Kong instances.
-
Each request produces a series of one or more "spans." Spans are very useful for debugging timing-related problems, especially when the ones belonging to the same trace are presented grouped together.
-
Information is thus gathered in a more *structured* way than with other logging plugins, requiring less parsing.
-
The trace abstraction can also be used to debug problems that occur in multi-service environments when requests "hop" over several elements of the infrastructure; they can easily be grouped under the same trace.
## Setup
For a basic setup, you only need Docker and Docker-compose. Here's the docker-compose.yml file that we will use:
version: '3'
networks: kong-net: services: # Kubernetes echo service, it just returns the requests it receives as responses
# This service will act as our upstream
http-echo: image: gcr.io/kubernetes-e2e-test-images/echoserver:2.2 networks: - kong-net
ports: - "8080:8080" tcp-echo: image: istio/tcp-echo-server:1.1 networks: - kong-net
ports: - "9000:9000"
# Our zipkin server
zipkin: image: openzipkin/zipkin:2 networks: - kong-net
ports: - "9411:9411" restart: on-failure
# Our Kong API gateway
# It expects a conf file in ./kong.yml for declarative configuration
kong: image: kong/kong:2.1.0 networks: - kong-net
environment: KONG_LOG_LEVEL: debug
KONG_ADMIN_ACCESS_LOG: /dev/stdout
KONG_ADMIN_ERROR_LOG: /dev/stderr
KONG_ADMIN_LISTEN:"0.0.0.0:8001" KONG_STREAM_LISTEN:"0.0.0.0:8500" KONG_DATABASE:"off" KONG_DECLARATIVE_CONFIG: /usr/local/kong/pwd/kong.yml
KONG_PROXY_ACCESS_LOG: /dev/stdout
KONG_PROXY_ERROR_LOG: /dev/stderr
volumes: - "$PWD:/usr/local/kong/pwd" ports: - "8000:8000/tcp" - "8001:8001/tcp" - "8500:8500/tcp" - "8443:8443/tcp" - "8444:8444/tcp" depends_on: - http-echo
- tcp-echo
- zipkin
healthcheck: test:["CMD","kong","health"] interval: 10s
timeout: 10s
retries:10
That's a call to Kong's Admin API (port 8000) using httpie. You should see a single service called echo_service. It indicates that Kong is up.
http :8080
That's a straight GET request to the echo server (port 8080) using httpie. It should return HTTP/1.1 200 OK, indicating that the echo server is answering requests.
echo world | nc 127.0.0.19000
That's a straight TCP connection to the TCP echo server (port 9000). It should answer "hello world." You might need to close the connection with CTRL-C.
##
## Tracing HTTP Traffic Through Kong
Let's start tracing with this command:
http :8000 host:echo.dev foo=bar
That's a POST request to the HTTP echo server *proxied through Kong's proxy port* (8000). The received answer should be very similar to the previous one, but with added response headers like Via: kong/2.0.1 . You should also see some of the headers that the Zipkin plugin added to the request, like x-b3-traceid.
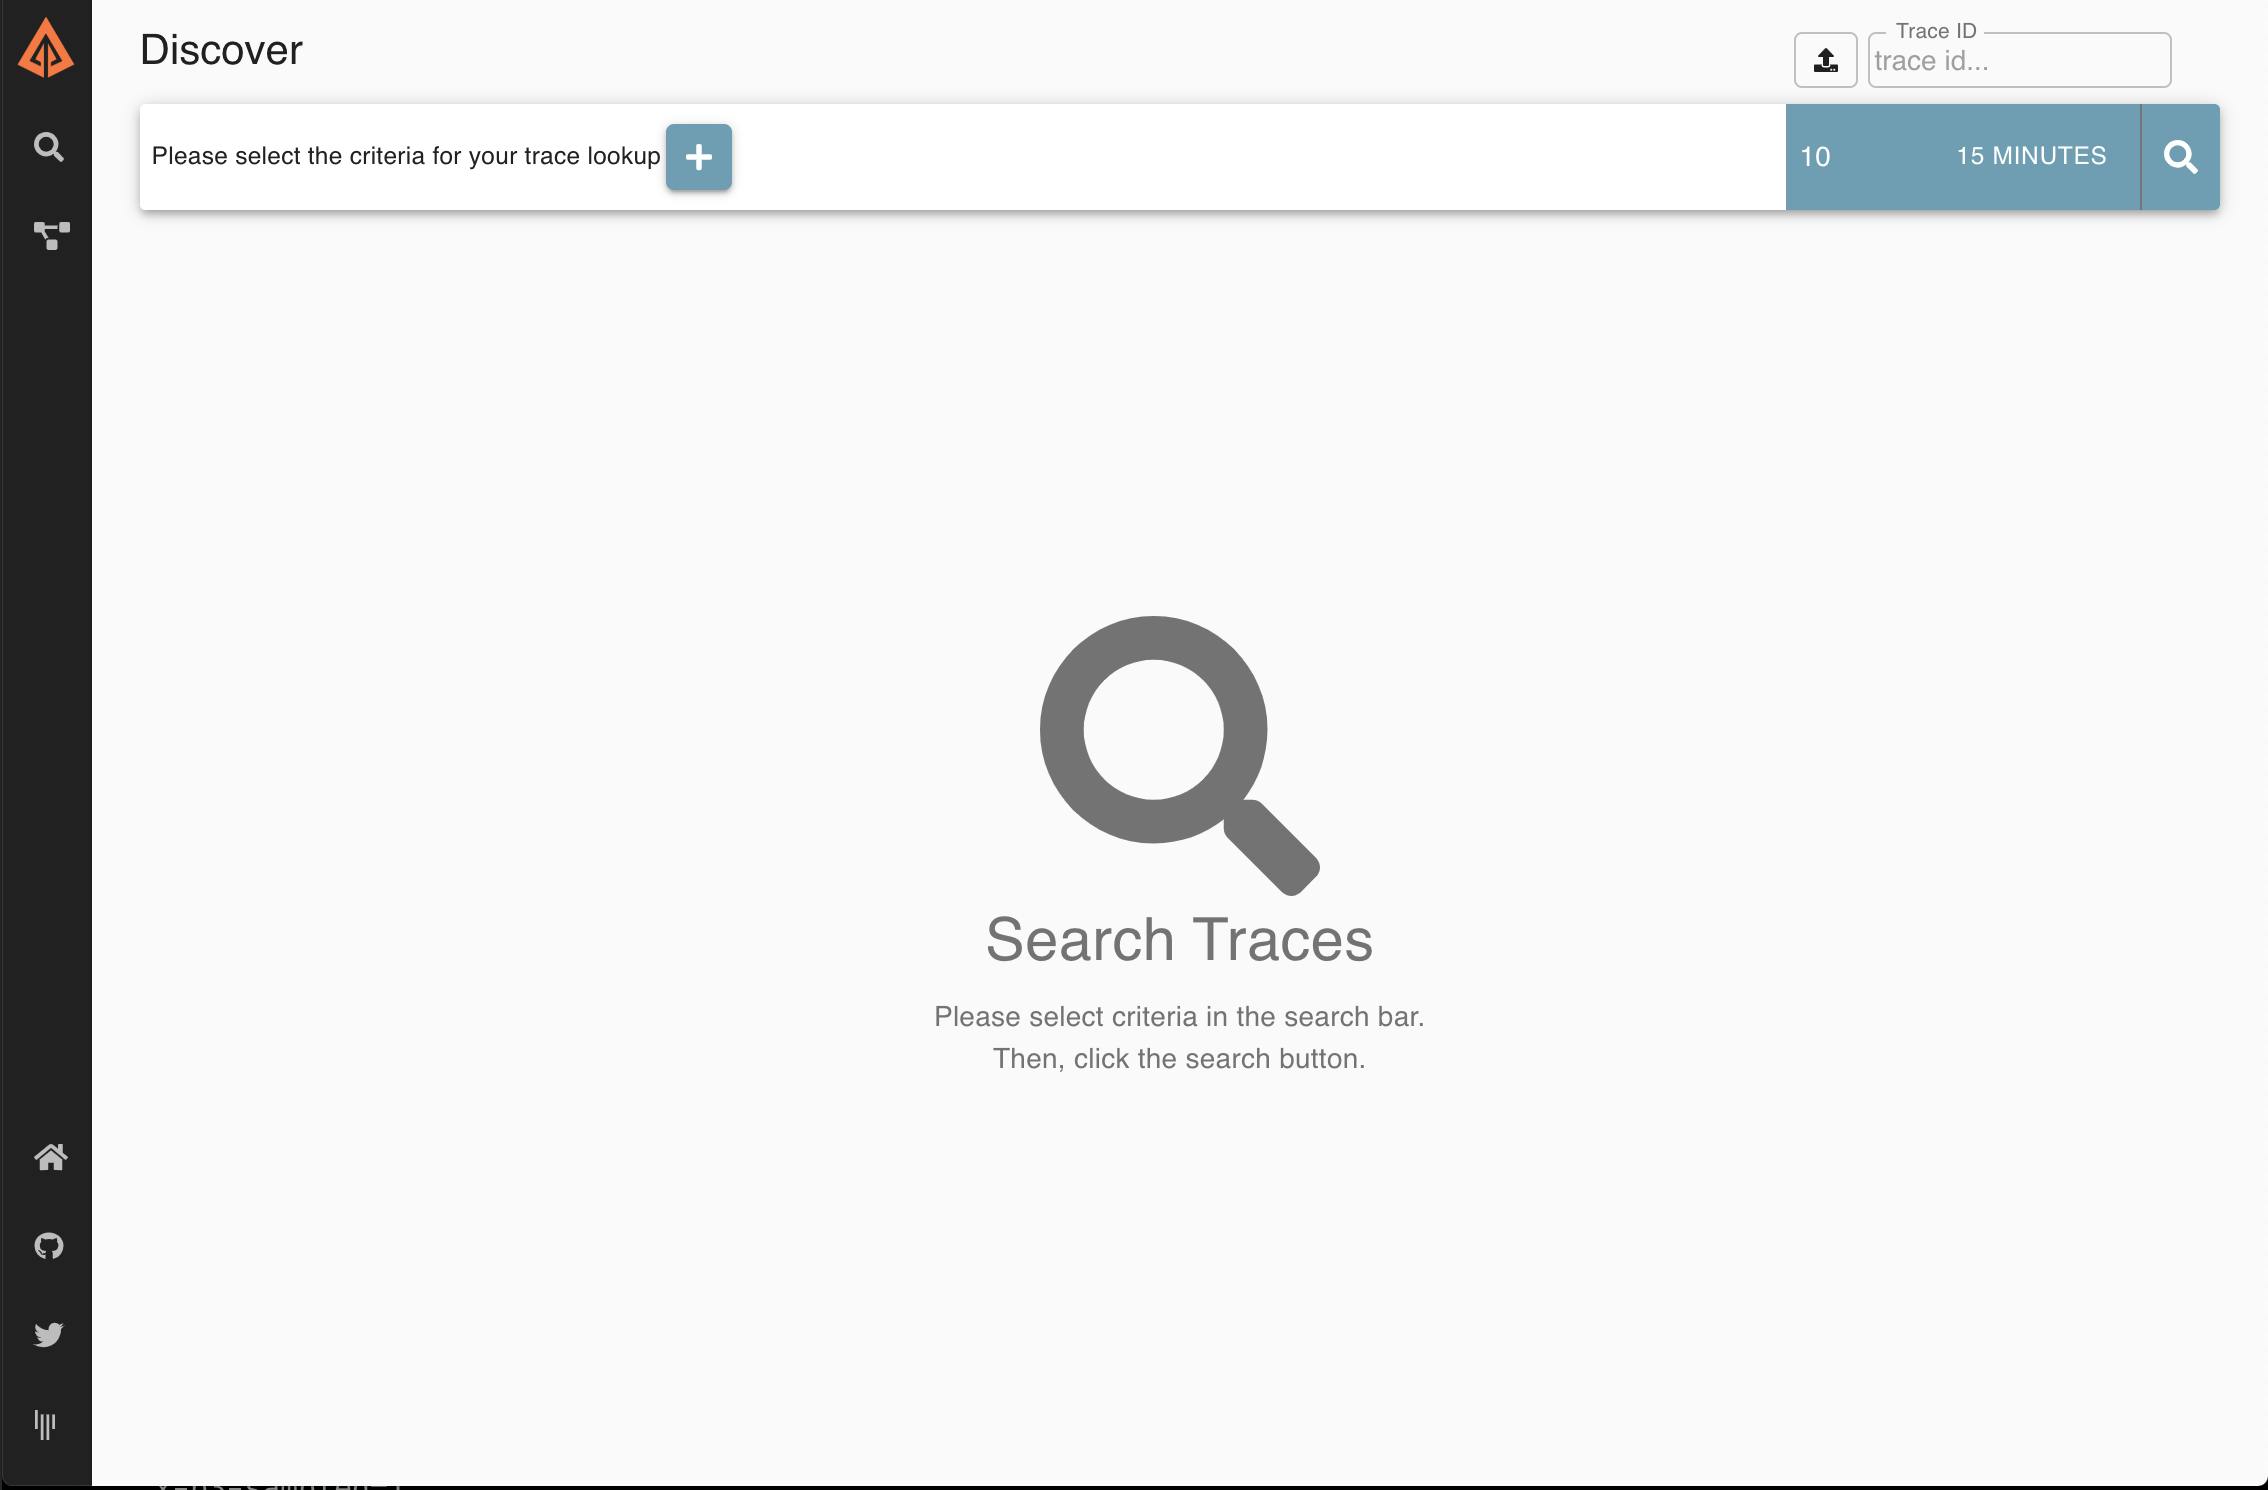
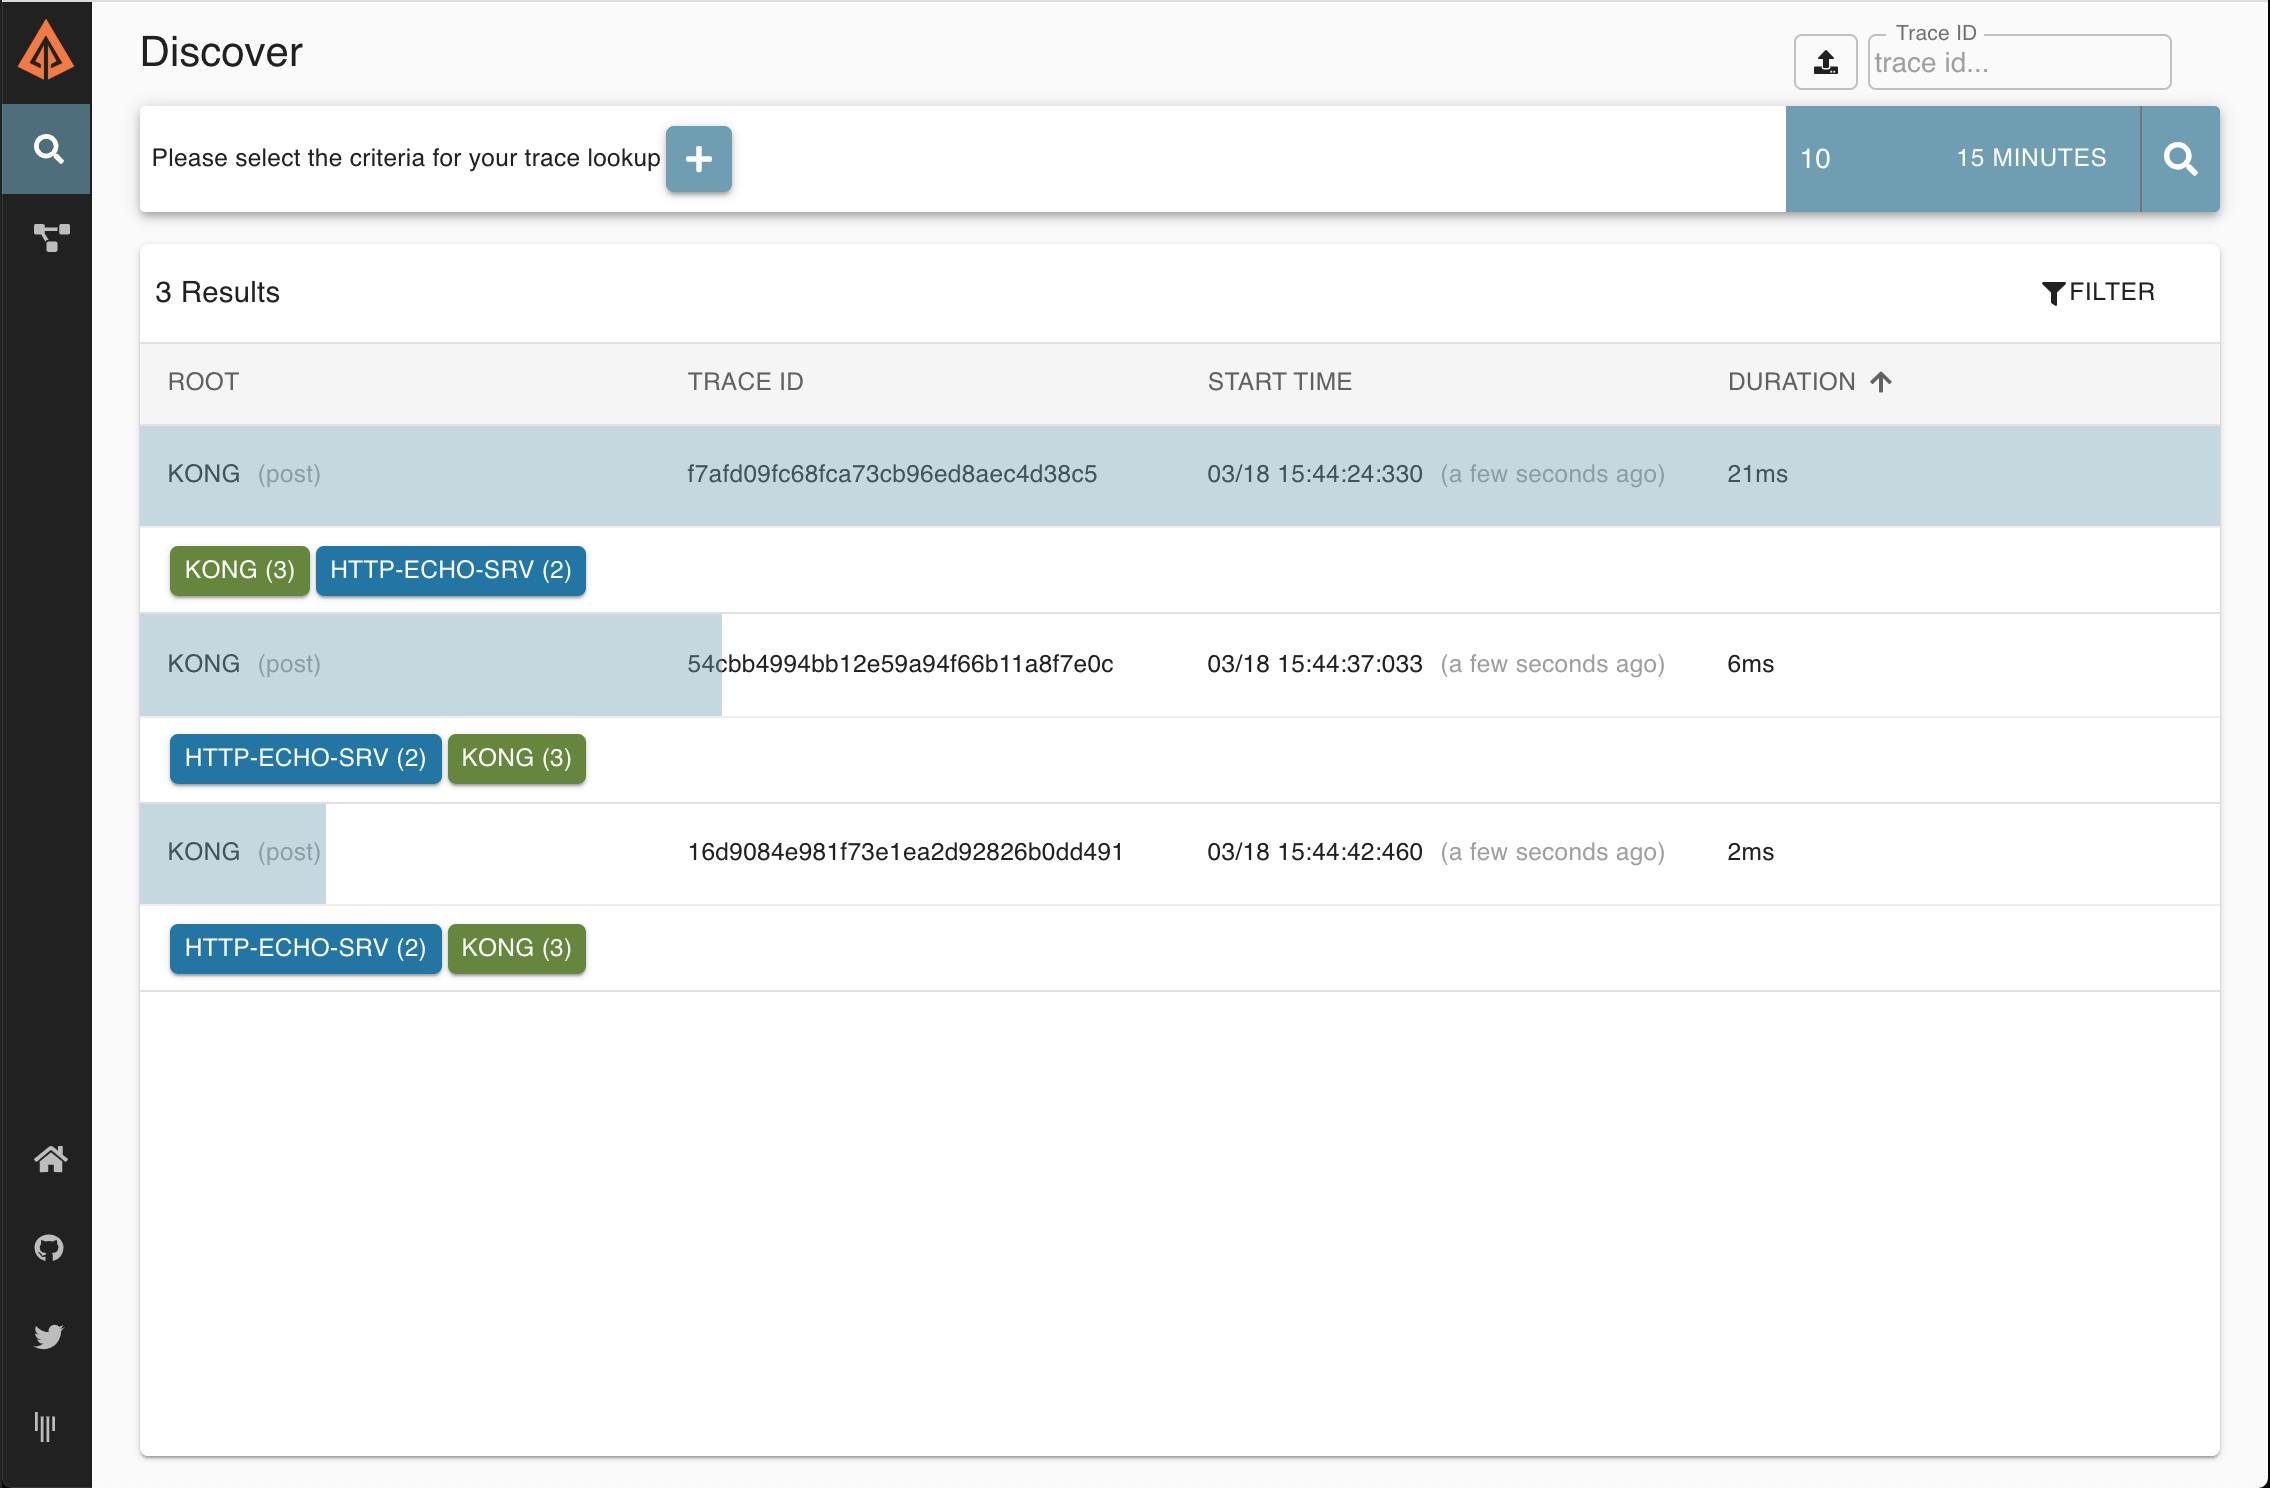
Now go back to the Zipkin UI interface in your browser (http://localhost:9411/zipkin/) and click on the magnifying glass icon (🔎 – You might need to click on Try new Lens UI first). You should be able to see each request as a series of spans.
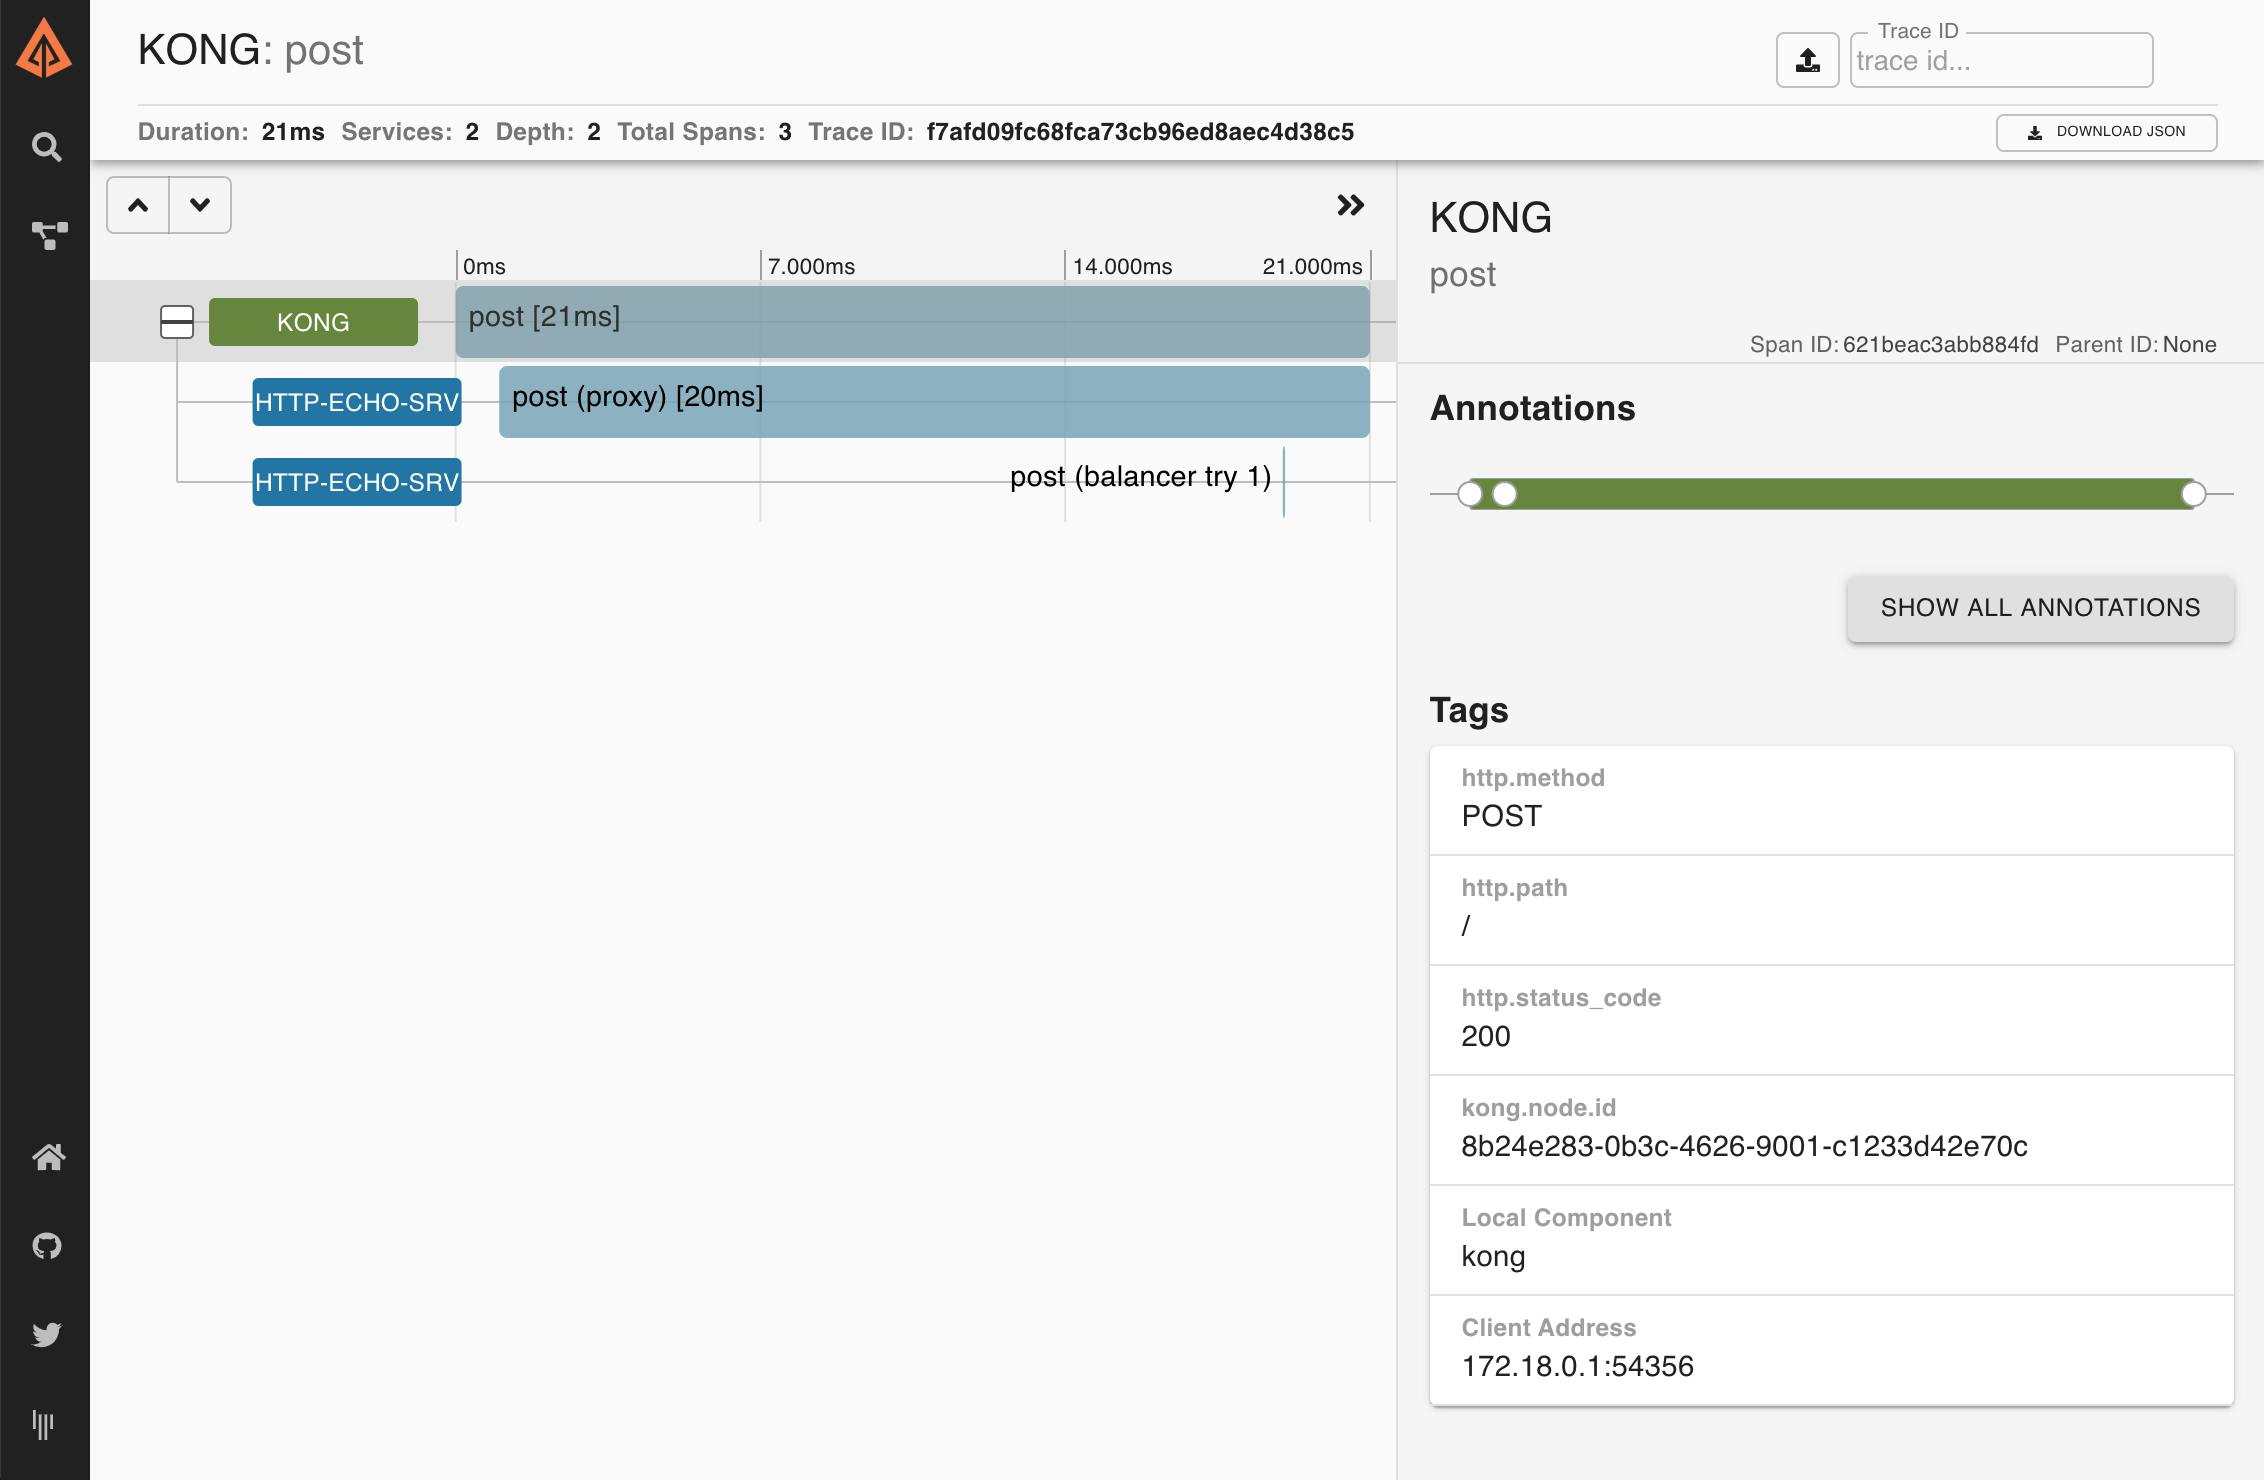
The Zipkin UI should display one trace per HTTP request. You may click on each individual trace to see more details, including information about how long each of the Kong phases took to execute:
This request is similar to the ones made before, but it includes an HTTP header called x-b3-traceid. This kind of header is used when a request is treated by several microservices and should remain unaltered when a request is passed around from one service to the other.
In this case, we can check that Kong is respecting this convention by checking that the headers returned in the response. One of them should be:
Our Zipkin plugin currently supports several of these tracing headers, and more are planned for future releases!
##
## Tracing TCP Traffic Through Kong
nc 127.0.0.18500
This will open a TCP connection to our TCP Echo server with Netcat. Write names and press enter to generate tcp traffic:
peter
hello peter
jannet
hello jannet
frank
hello frank
Press Ctrl-C to finish and close the connection — that is a requirement for the next step.
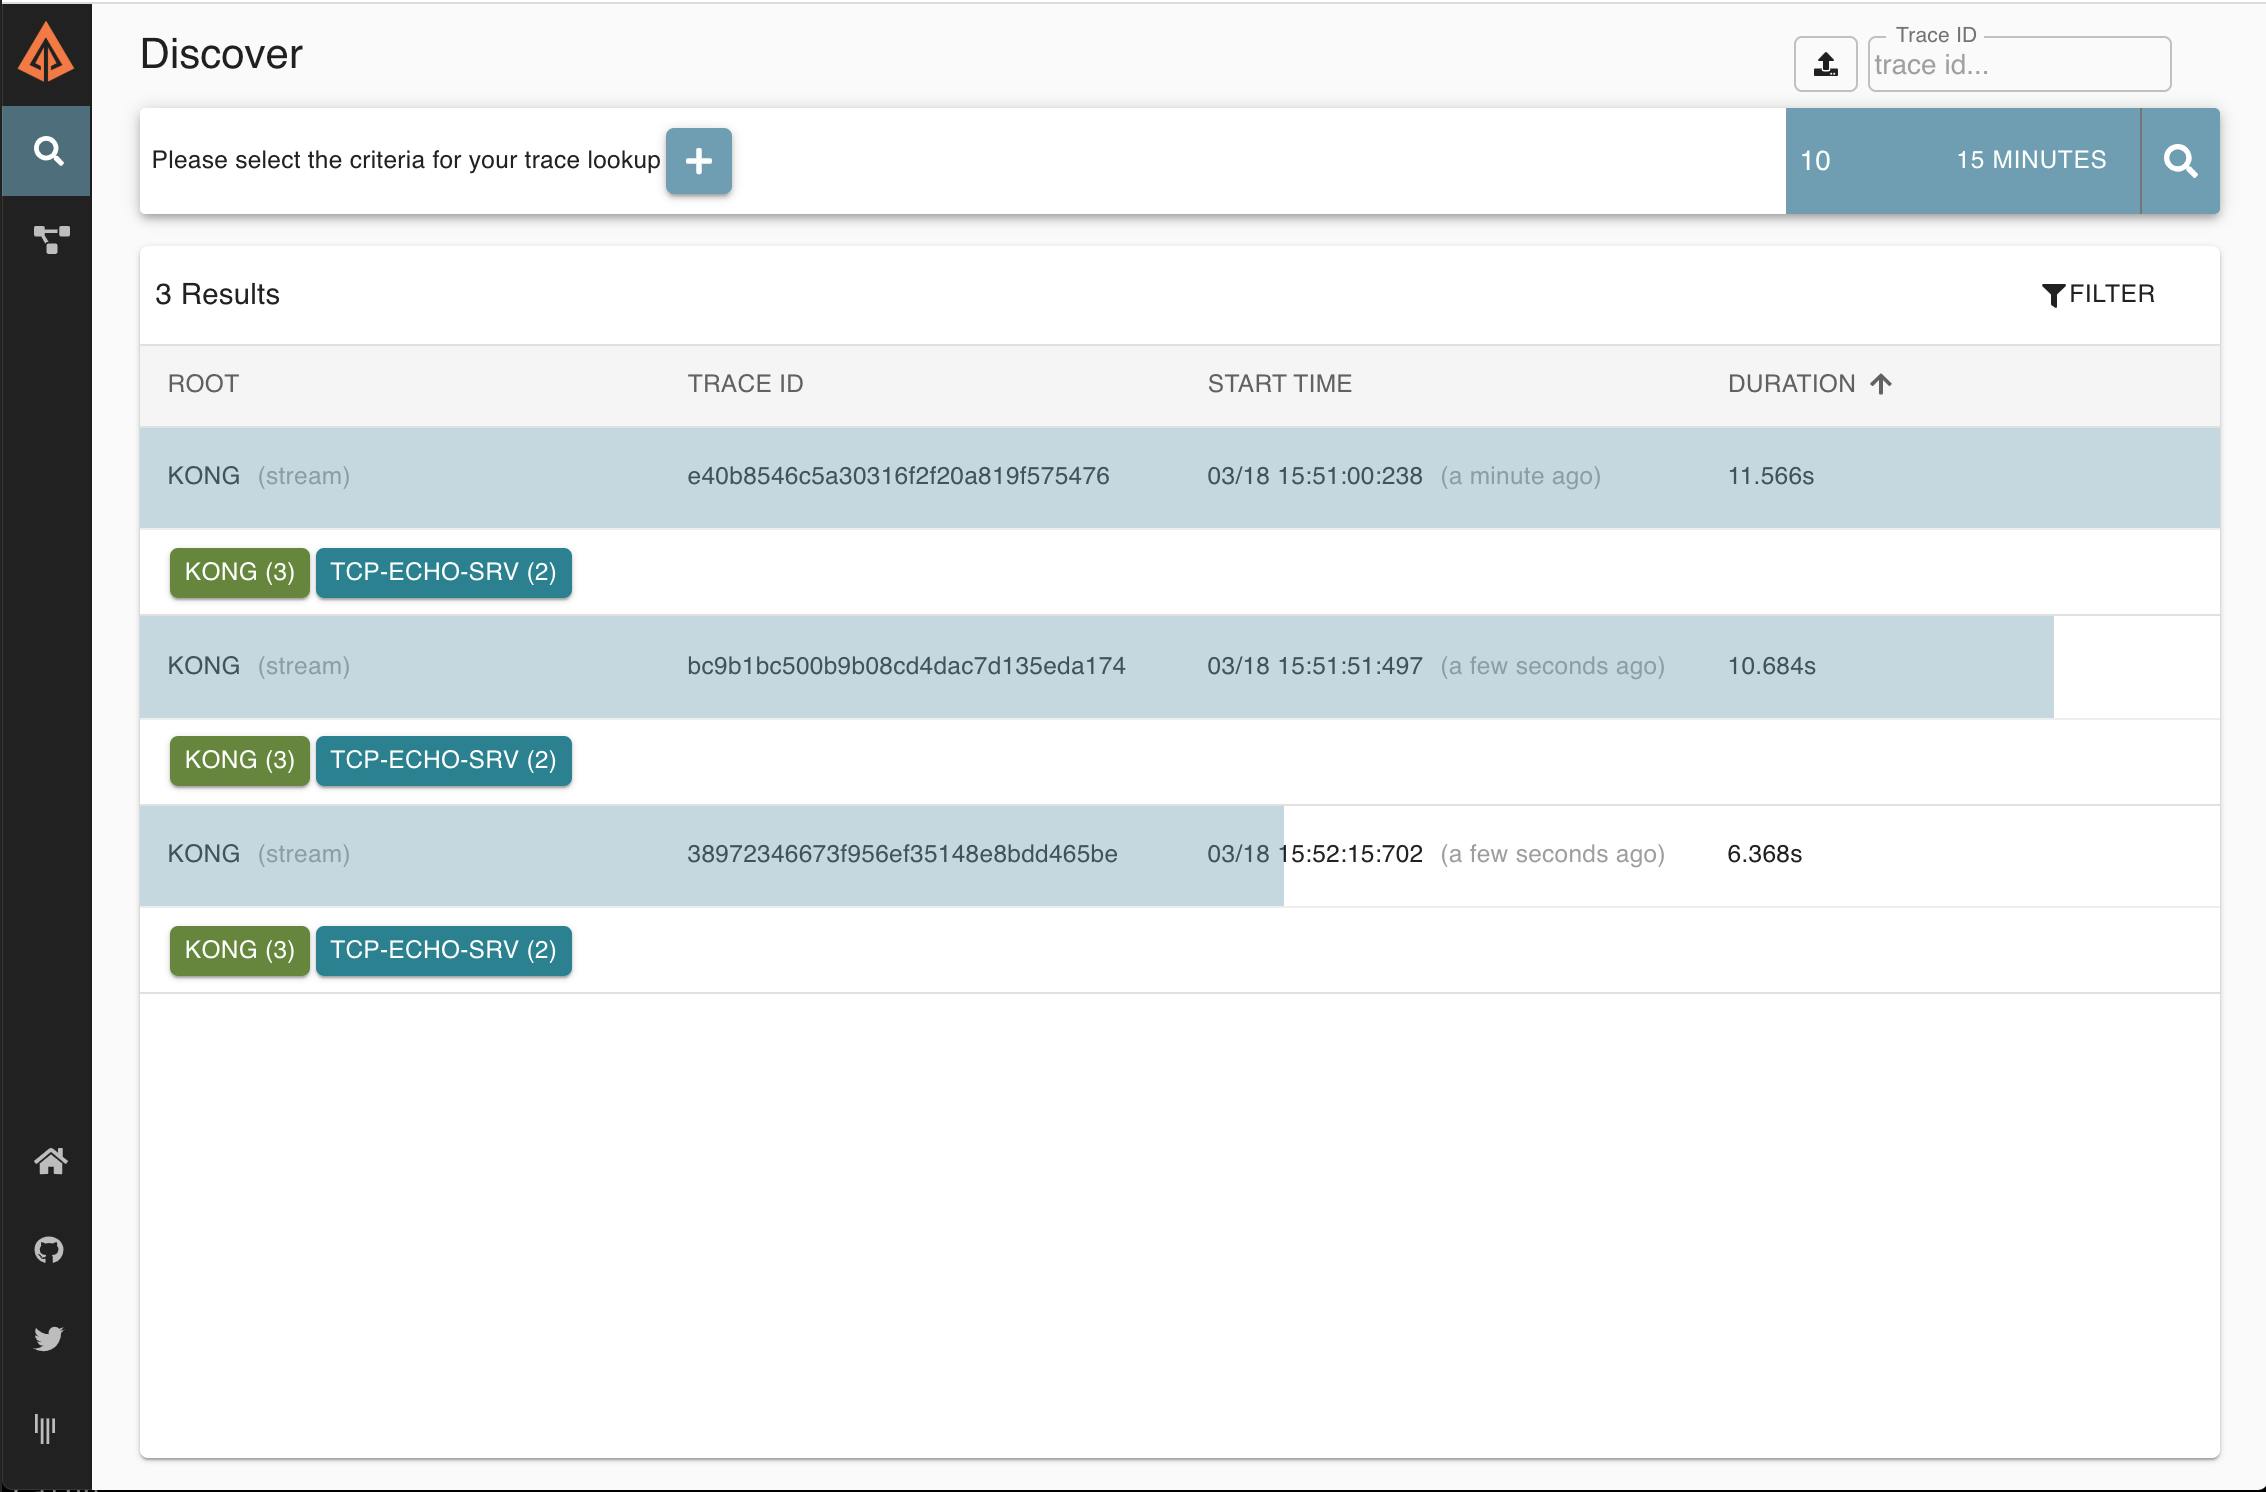
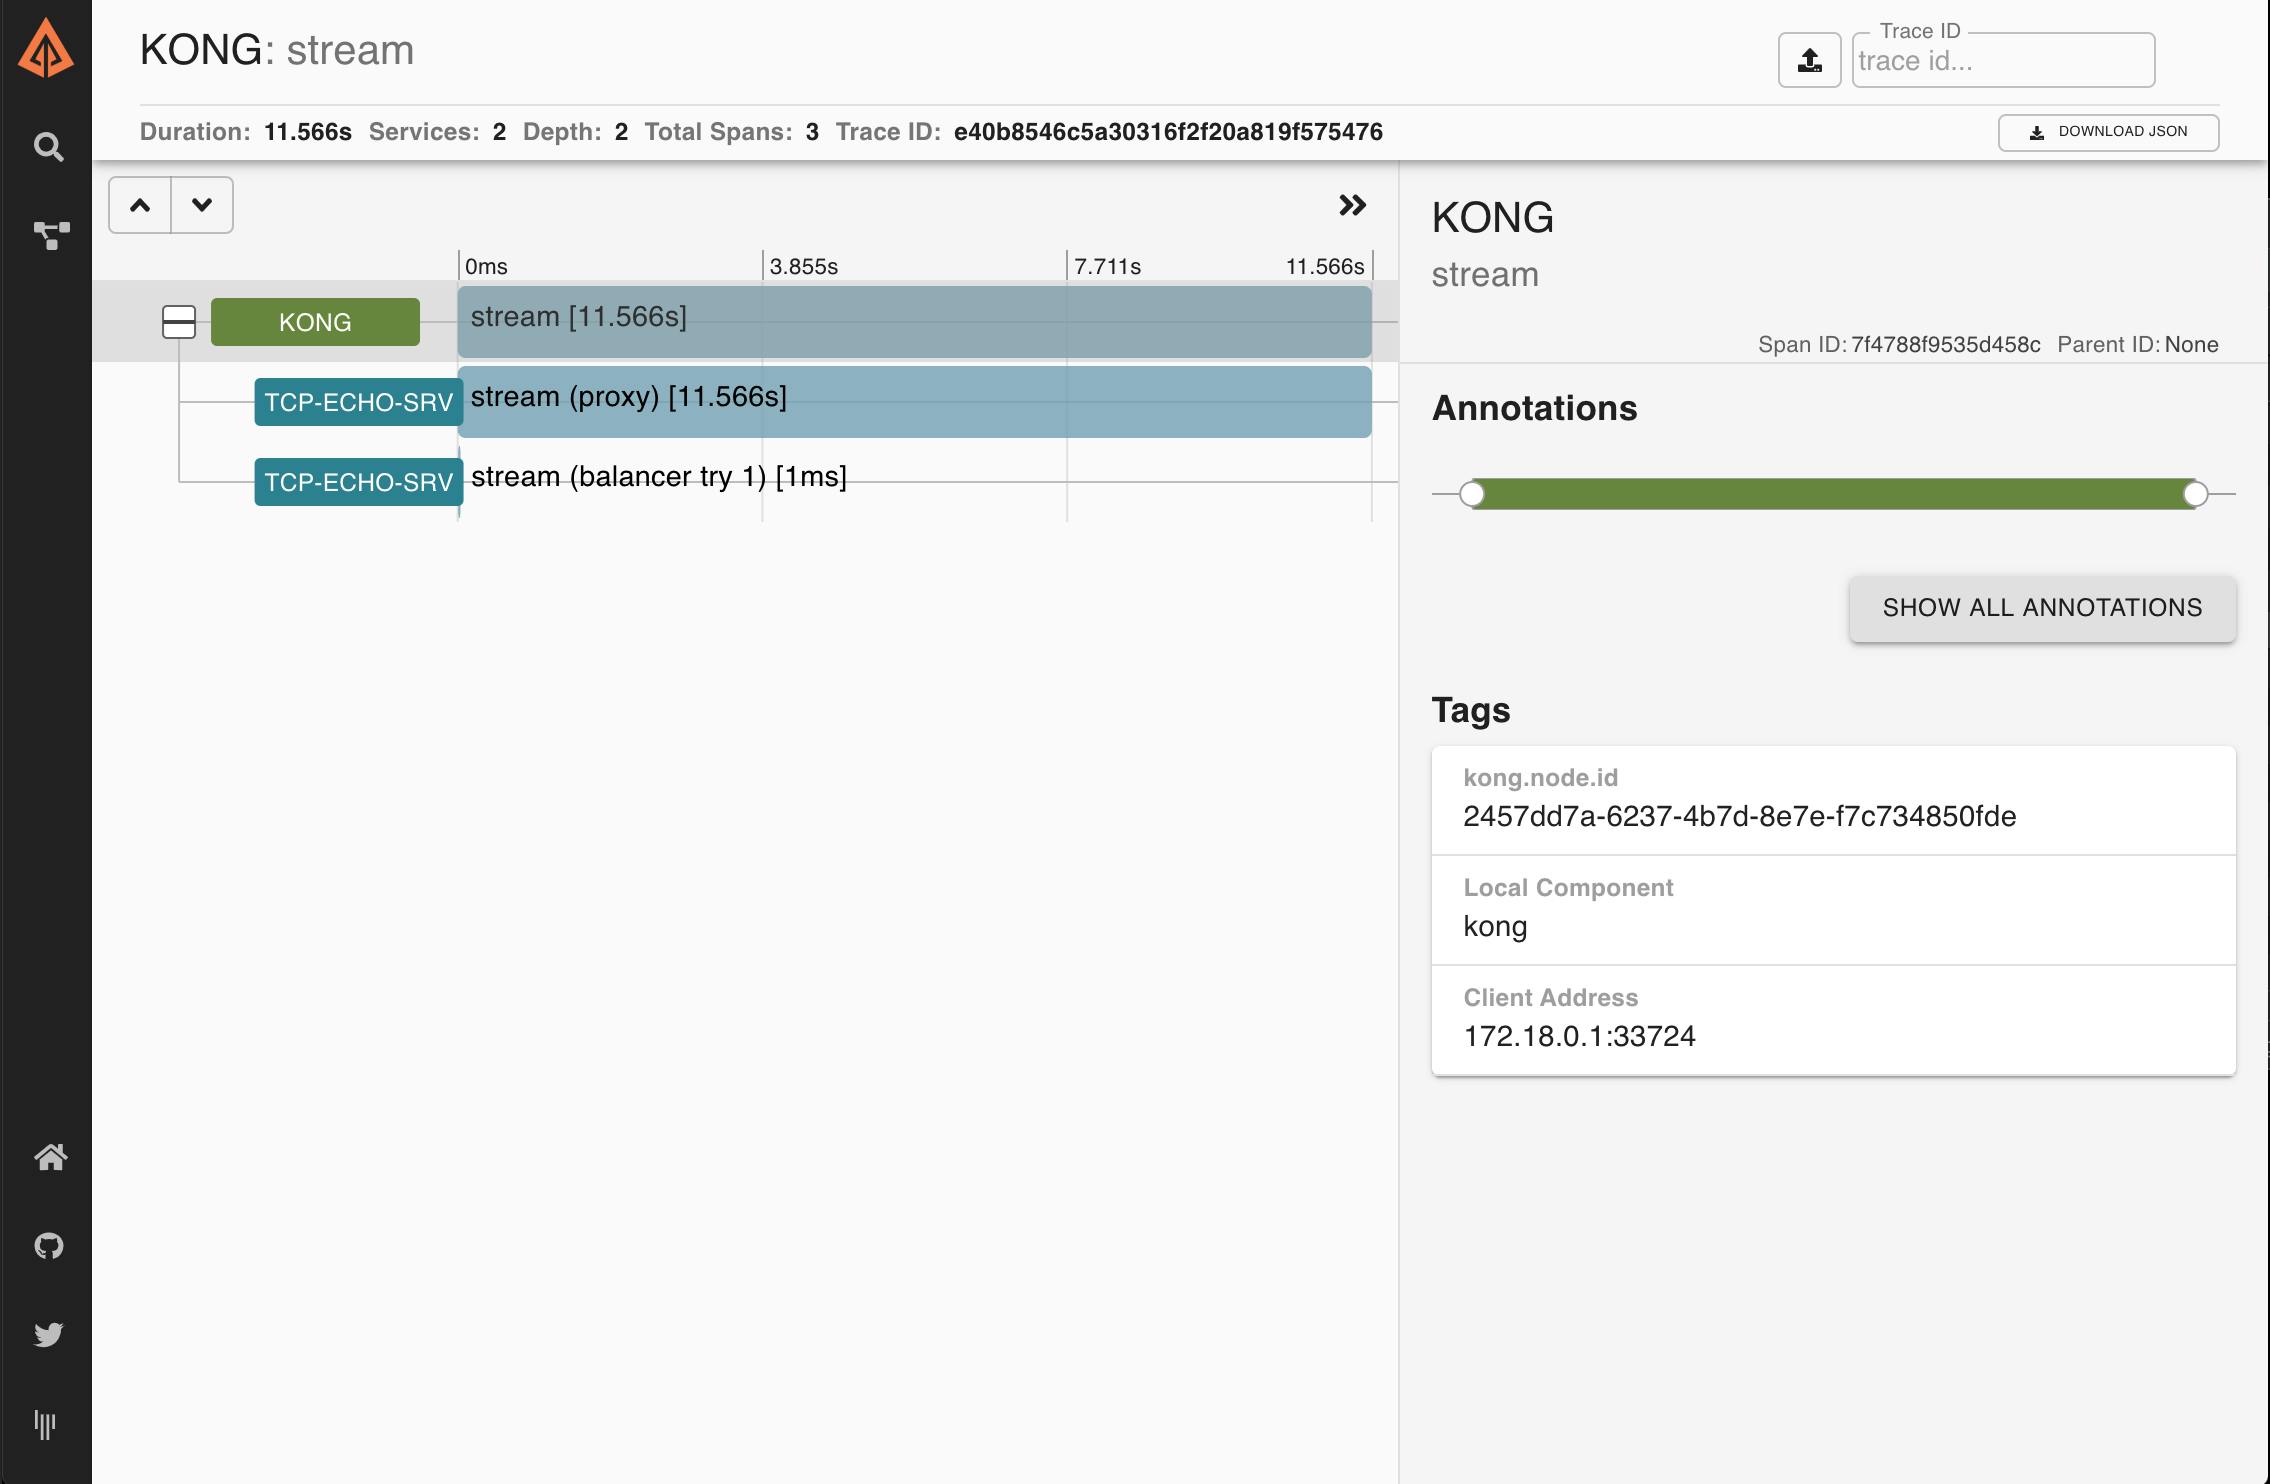
This should have created some traces on Zipkin — this time for TCP traffic. Open the Zipkin UI in your browser (http://localhost:9411/zipkin/) and click on the magnifying glass icon (🔎). You should see new traces with spans. Note that the number of traces you see might be different from the ones shown in the following screenshot:
As before, you should be able to see each individual trace in more detail by clicking on them:
TCP traffic, by its own nature, is not compatible with tracing headers.
## Conclusion
This was just an overview of some of the features available via the Kong Zipkin Plugin when Kong is being used as an API gateway. The tracing headers feature, in particular, can help shed some light on problems occurring on multi-service setups. Stay tuned for other articles about this!
Built on top of Kong API Gateway, the Kong AI Gateway is designed to address key challenges in enterprise AI adoption. Modern AI applications rarely rely on a single model; instead, they orchestrate multiple GenAI providers, agent frameworks, Age
Anika Suri
# Building a Secure, Scalable AI Infrastructure with Kong and Akamai: A Technical Introduction
Together, the following components represent the three layers of the new AI platform: AI Gateway: Kong AI Gateway (including MCP support) controls both GenAI and MCP flow and orchestrates the existing services like Vector Databases, Event Streaming,
Marco Raffaelli
# Migrating Your Collections and Requests from Postman to Insomnia
Local-first: your data stays with you: Insomnia stores everything on your machine by default. No forced cloud sync, no account needed just to send a request. This is helpful if privacy or working in a regulated environment is a priority for you Fre
Juhi Singh
# Beyond Static Routing: Modernizing API Logic with Conditional Policy Execution
Imagine you have a single Service, order-api . You want to apply a strict rate limit to most traffic, but you want to bypass that limit—or apply a different one—if the request contains a specific X-App-Priority: High header. Previously, you had t
How OAuth 2.0 Token Exchange Reshapes Trust Between Services — and Why the API Gateway Is Exactly the Right Place to Enforce It
Modern applications don’t run as a single monolithic. They are composed of services — frontend APIs, backend microservi
Veena Rajarathna
# Practical Strategies to Monetize AI APIs in Production
Traditional APIs are, in a word, predictable. You know what you're getting: Compute costs that don't surprise you Traffic patterns that behave themselves Clean, well-defined request and response cycles AI APIs, especially anything that runs on LLMs
Deepanshu Pandey
# Connecting Kong and Solace: Building Smarter Event-Driven APIs
Running Kong in front of your Solace Broker adds real benefits: Authentication & Access Control – protect your broker from unauthorized publishers. Validation & Transformation – enforce schemas, sanitize data, and map REST calls into event topics.
Hugo Guerrero
# A Unified Gateway for APIs + Agentic Applications on VMware VKS with Kong Konnect
Built on top of Kong API Gateway, the Kong AI Gateway is designed to address key challenges in enterprise AI adoption. Modern AI applications rarely rely on a single model; instead, they orchestrate multiple GenAI providers, agent frameworks, Age
Anika Suri
# Building a Secure, Scalable AI Infrastructure with Kong and Akamai: A Technical Introduction
Together, the following components represent the three layers of the new AI platform: AI Gateway: Kong AI Gateway (including MCP support) controls both GenAI and MCP flow and orchestrates the existing services like Vector Databases, Event Streaming,
Marco Raffaelli
# Migrating Your Collections and Requests from Postman to Insomnia
Local-first: your data stays with you: Insomnia stores everything on your machine by default. No forced cloud sync, no account needed just to send a request. This is helpful if privacy or working in a regulated environment is a priority for you Fre
Juhi Singh
# Beyond Static Routing: Modernizing API Logic with Conditional Policy Execution
Imagine you have a single Service, order-api . You want to apply a strict rate limit to most traffic, but you want to bypass that limit—or apply a different one—if the request contains a specific X-App-Priority: High header. Previously, you had t
How OAuth 2.0 Token Exchange Reshapes Trust Between Services — and Why the API Gateway Is Exactly the Right Place to Enforce It
Modern applications don’t run as a single monolithic. They are composed of services — frontend APIs, backend microservi
Veena Rajarathna
# Practical Strategies to Monetize AI APIs in Production
Traditional APIs are, in a word, predictable. You know what you're getting: Compute costs that don't surprise you Traffic patterns that behave themselves Clean, well-defined request and response cycles AI APIs, especially anything that runs on LLMs
Deepanshu Pandey
# Connecting Kong and Solace: Building Smarter Event-Driven APIs
Running Kong in front of your Solace Broker adds real benefits: Authentication & Access Control – protect your broker from unauthorized publishers. Validation & Transformation – enforce schemas, sanitize data, and map REST calls into event topics.
Hugo Guerrero
## Ready to see Kong in action?
Get a personalized walkthrough of Kong's platform tailored to your architecture, use cases, and scale requirements.