With an application segmented into dozens (or hundreds!) of microservices, **monitoring** and consolidated **logging** become imperative. At any given moment, one of your microservices could fail or throw an error or begin hogging resources. You need to monitor for this so that you can respond quickly and appropriately. In addition, your ability to troubleshoot errors and understand system behavior depends heavily on the existence and effectiveness of your logging tool.
**This content contains a video which can not be displayed in Agent mode**
## Our Sample Microservice Application
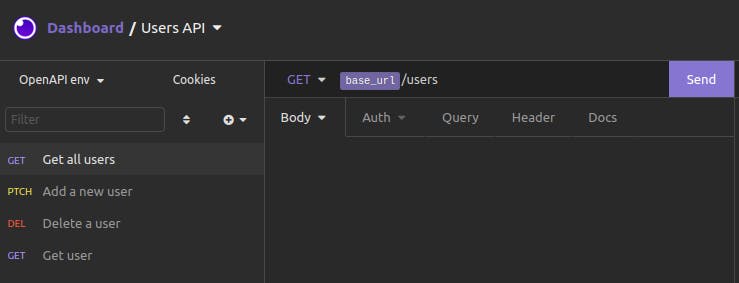
Before we dive into microservices monitoring and logging, let's briefly go over our sample microservices application. We have three API services: Users, Products and Orders. Each service has two GET endpoints and one POST endpoint. The code for these simple services, which were built with Node.js and Express, is [publicly available](https://bit.ly/konnect-sample-app)publicly available.
We have deployed all three of our services to GCP Cloud Functions. Below are the outputs for sample curl requests to our Users service:
# GET ALL USERS
$ curl -X GET https://us-central1-konnect-logging-monitoring.cloudfunctions.net/users-service{"49fd1cdc-861e-4780-9c7c-751ed9e80562":{"id":"49fd1cdc-861e-4780-9c7c-751ed9e80562","name":"Abigail Anderson"},"05983579-b74b-4045-827f-046dcf4fd4ce":{"id":"05983579-b74b-4045-827f-046dcf4fd4ce","name":"Barry Bledsoe"},"abd80c81-7a15-4d51-84c4-cde80c6a7f03":{"id":"abd80c81-7a15-4d51-84c4-cde80c6a7f03","name":"Charlie Chesterton"},"8c988844-8b49-425f-908c-085e7efb9905":{"id":"8c988844-8b49-425f-908c-085e7efb9905","name":"Daniel Donaldson"}}
# GET A USER BY ID
$ curl -X GET https://us-central1-konnect-logging-monitoring.cloudfunctions.net/users-service/733ac316-9b3d-47c7-a0c2-3229f4d2caa1{"id":"733ac316-9b3d-47c7-a0c2-3229f4d2caa1","name":"Elise Edwards"}
The Products and Orders services work similarly.
We would like to have monitoring for each of these services to see response status codes, response times and traffic throughput. We already have [Prometheus](https://prometheus.io)Prometheus and [Grafana](https://grafana.com)Grafana up and running, ready to capture and display metrics. We just need to add this monitoring solution to our services.
We'd also like to have consolidated logging sent to a single location for all services. We already have a [Loggly](https://www.loggly.com)Loggly account set up and ready to receive logs. Again, we just need to add this logging tool to our services.
## Microservices Monitoring and Logging Setup: The Manual Hard Way
Let's consider the level of effort for manually hooking our services into our monitoring and logging solutions.
### Manually Adding Monitoring to Our Services
Since we're running Prometheus, and our services all happen to be Node.js Express servers, perhaps the most straightforward approach would be to use the [express-prom-bundle](https://www.npmjs.com/package/express-prom-bundle)express-prom-bundle package. This package is a Prometheus metrics middleware that captures metrics and exposes them at the /metrics endpoint for the server. Simple enough.
Of course, that means we'll need to modify the package.json and server.js files for each of our three services. We'll need to add the package to our project, then add the lines of code to server.js to use the middleware. After that, we'll need to redeploy our newly updated service.
Our three services now expose their metrics at the /metrics endpoint for each of their respective URLs. We'll need to update the configuration for our Prometheus service, making sure that the scrape configs include three targets—one for each service.
### Manually Adding Logging to Our Services
Similarly, if we want our services' log messages sent to a centralized location—like Loggly—then we'll probably use the most straightforward Node.js package for this. That's likely the [winston-loggly-bulk](https://www.npmjs.com/package/winston-loggly-bulk)winston-loggly-bulk package. Similar to the package for integrating Prometheus, we'll need to add this logging package to each of our three projects and modify server.js to use the package. And, of course, we'll also need to redeploy our services after we've updated them.
### What if There Were More Than Three Microservices?
A full-featured and robust business application probably has more than three microservices. An application may have dozens of microservices or more. They also won't all be uniform Node.js Express servers.
With just three services to hook into a monitoring and logging solution, the manual approach is already bad enough. What if we had a dozen microservices? What would the level of effort be if we were to add a new microservice in the future?
The manual approach involves repetitive and mechanical work, which means there's a lot of room for making an improper code update, forgetting a microservice altogether, or making proper updates but overlooking the need to redeploy. In addition to being error-prone, the manual approach is time-consuming. This kind of task can be demoralizing for any developer, especially since it doesn't seem to contribute directly to core product development.
There is a better way.
## Level Up Your API Game: Advanced Analytics for Unprecedented Observability
## Microservices Monitoring and Logging Setup With (the Easy Button) Konnect
Rather than take the manual approach, let's work with an infrastructure supported by Kong Konnect. We'll outline the steps for getting set up with Kong Konnect, but remember, you only need to do this at the start. After you are up and running with Kong Konnect, adding new services or adding monitoring or logging solutions is simple.
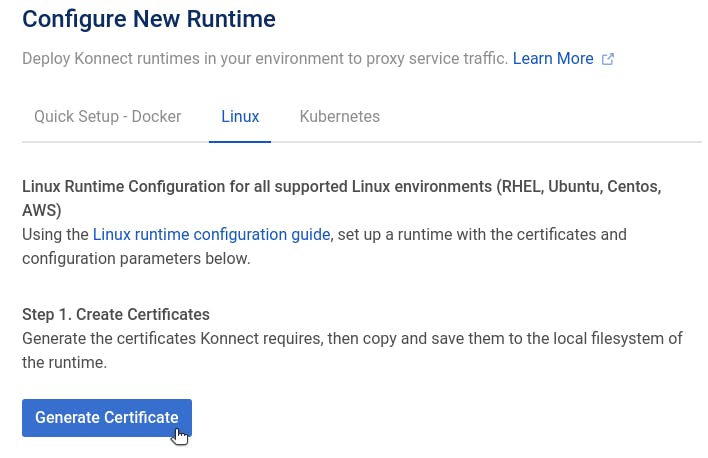
We need to configure Kong Gateway with certificates for authentication to Kong Konnect. After logging in to your Konnect account, click on *Runtimes* and find the environment where you will deploy your Kong Gateway. For our Linux environment, we click on *Generate Certificates* to get the files we need.
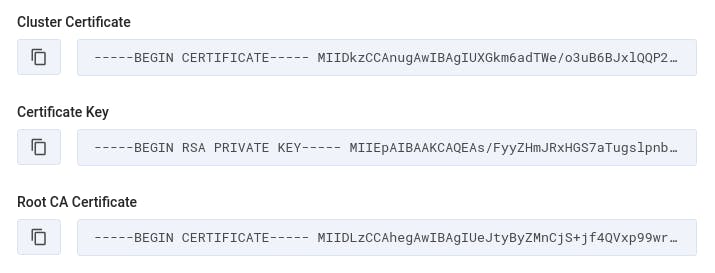
We immediately see three strings that we need to copy to files on our local machine.
The "Cluster Certificate" should be copied to a file called tls.crt. We should copy the "Certificate Key" to a file called tls.key. Lastly, the "Root CA Certificate" should be copied to a file called ca.crt.
#### Configure Kong Gateway
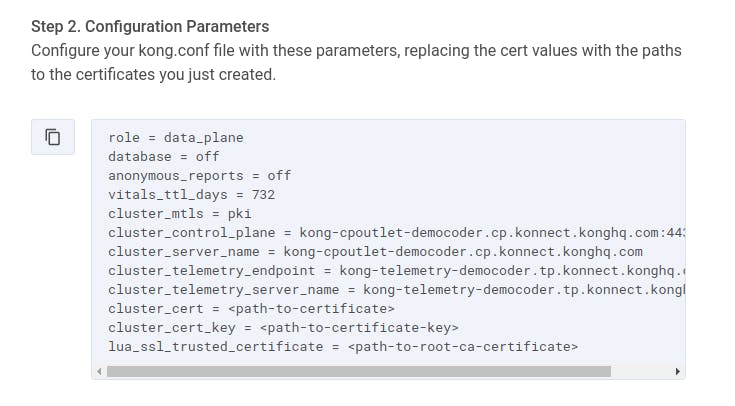
Next, Konnect displays a list of configuration parameters that we need to add to the Kong Gateway startup configuration file (typically located at /etc/kong/kong.conf):
For the last three lines of these parameters, you'll need to enter the absolute path to the three certificate-related files you just created.
In addition to the above parameters, we also want to **set the status_listen parameter** so that Kong's Status API will be exposed for a monitoring tool (like Prometheus) to receive metrics. This parameter is at around line 517 of our kong.conf file, and we set it to 0.0.0.0:8001.
With our parameters in place, we run the command kong start.
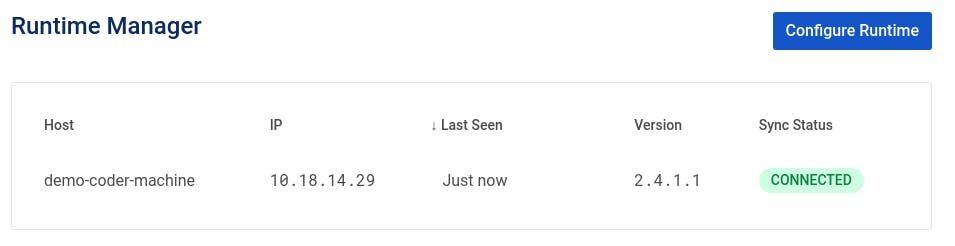
#### Verify Connection in Runtime Manager
After a few moments, our local Kong Gateway runtime will connect to Kong Konnect, and the Runtime Manager on Kong Konnect will show the established connection:
Now that we're connected, we can begin adding services.
### Add Services to Kong Konnect
In the ServiceHub for Konnect, we click on *Add New Service*. We'll start by adding the Users service that is running at GCP.
We set a name, version and description for our service:
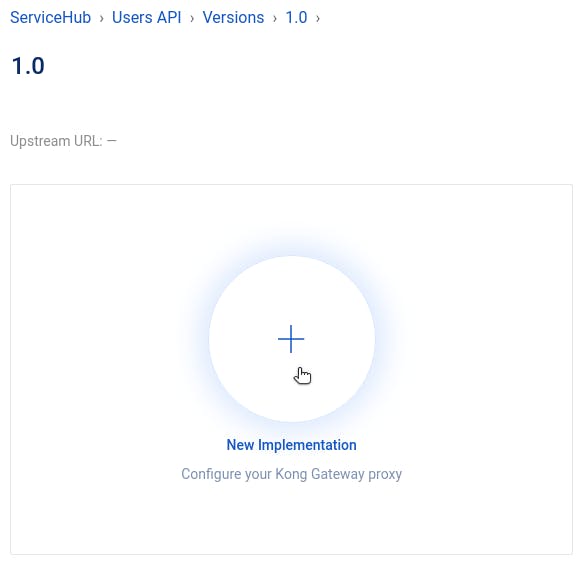
With our service created, we navigate to our 1.0 version to create a new implementation.
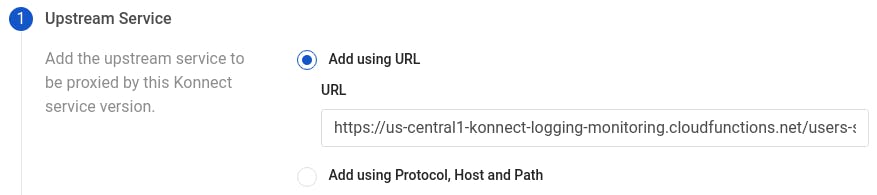
This is where we create an upstream service and an associated route. We add a URL for our upstream service, using the GCP Cloud Function URL where we deployed our service.
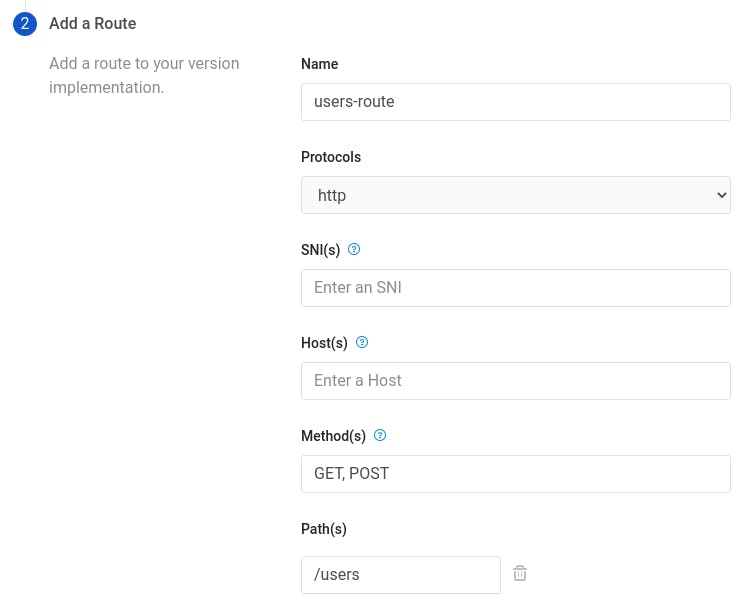
Then, we click on *Next* to configure the route for our service. We set a name for our route, choose the HTTP protocol (since we are running Kong Gateway locally), enter methods to listen for, and add a path.
The steps for adding the Orders and Products services are identical to what we've done above. After we've done that, curl requests to localhost are proxied by Kong to reach out to our GCP Cloud Functions:
Now, we're all set up with Kong Konnect. That may seem like a lot of steps, but we've just completed the setup for our entire microservices architecture and connectivity solution! If we need to modify a service—perhaps to point to a different Cloud Function URL or listen on a different path—it's simple to make those changes here in a central place, Kong Konnect. Whenever we need to add or remove a service, we do that here, too.
### Adding Microservices Monitoring
Now, the big question is: What's the level of effort for adding a monitor microservices solution to each of my services? The level of effort is "a couple of clicks." Let's walk through it. Don't blink, or you'll miss it.
#### Adding the Prometheus Plugin
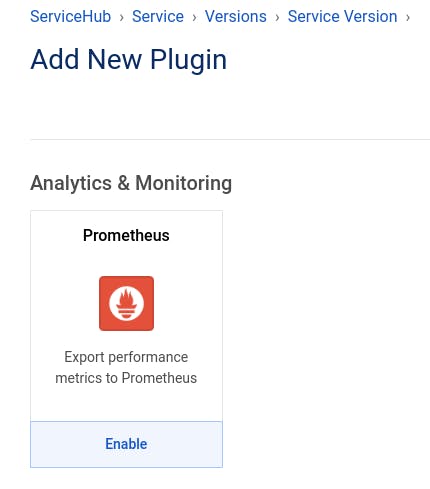
In our Users API service in Kong Konnect, we navigate again to our 1.0 version. At the bottom of the page, we click on *New Plugin*. We search for the Prometheus plugin. When we find it, we click on *Enable*.
We enter a tag so that metrics associated with this service are all grouped together. Then, we click on *Create*.
And… we're done. Yes, that was it.
We do the same for our Orders API service and our Products API service.
When reviewing our manual approach, you'll recall that we needed to reconfigure the scrape_configs in Prometheus, adding a target for each microservice exposing metrics. In this Kong Konnect approach, there is only one location exposing metrics—our Kong Gateway, at port 8001. Whether you have one service or three or a hundred, Kong Konnect serves as the single target for scraping all Prometheus metrics. Our prometheus.yml file looks like this:
With our configuration set, we start our Prometheus server and our Grafana server.
#### Configuring Grafana
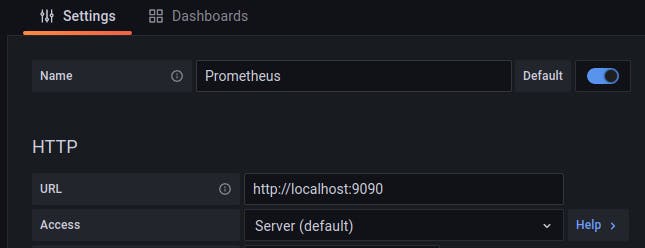
With the Grafana server up and running, we can log in and add our data source:
We add Prometheus as a data source, using the URL for the Prometheus server (http://localhost:9090).
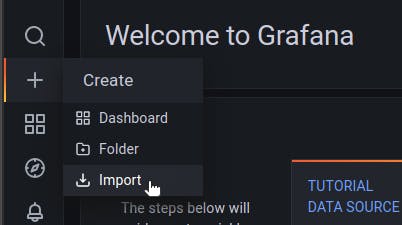
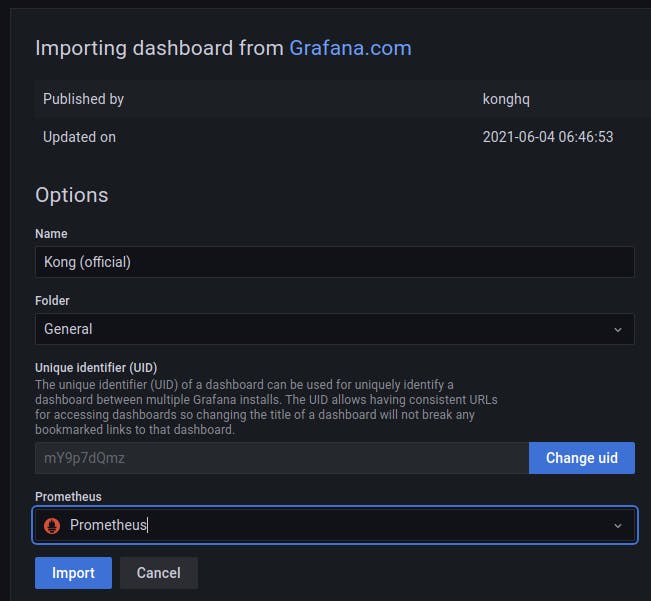
To import the Kong dashboard, click on *Import *in the side navbar:
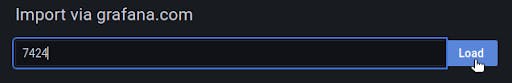
In the field for a Grafana dashboard ID, enter 7424:
Configure the Kong dashboard to use the Prometheus data source, and then click on *Import*.
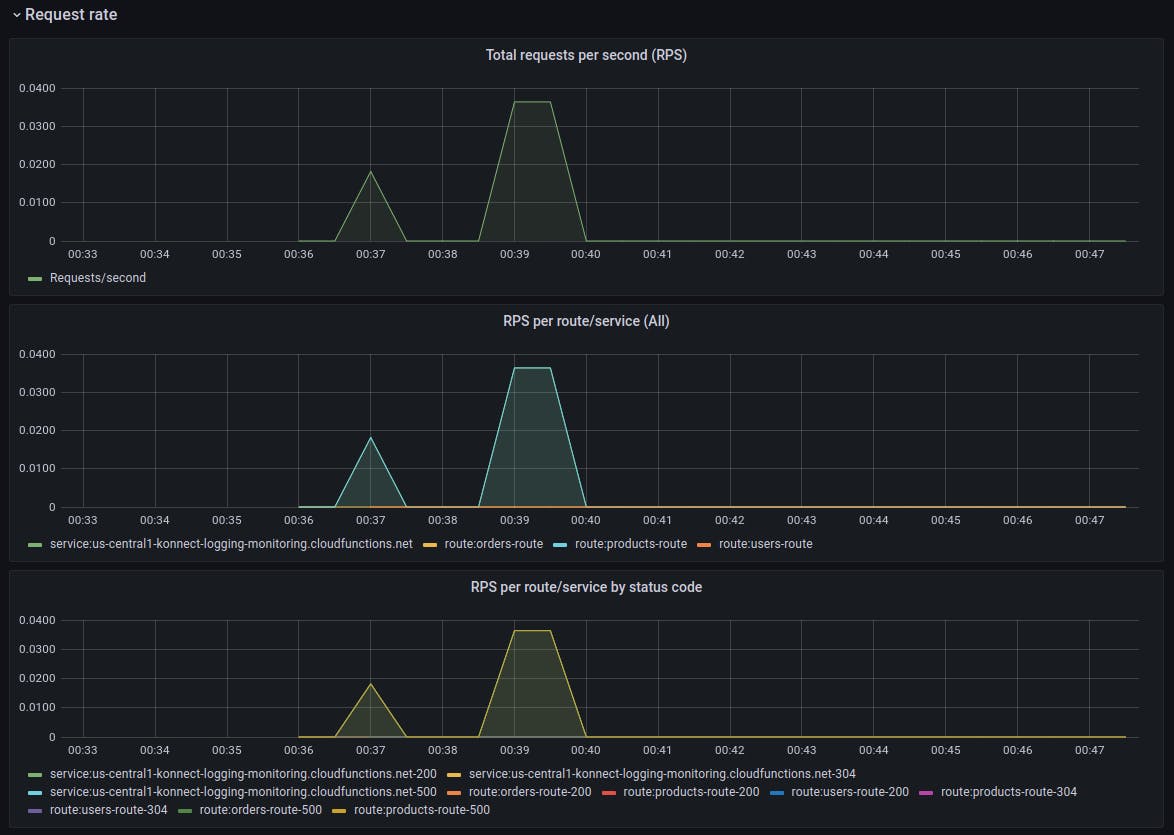
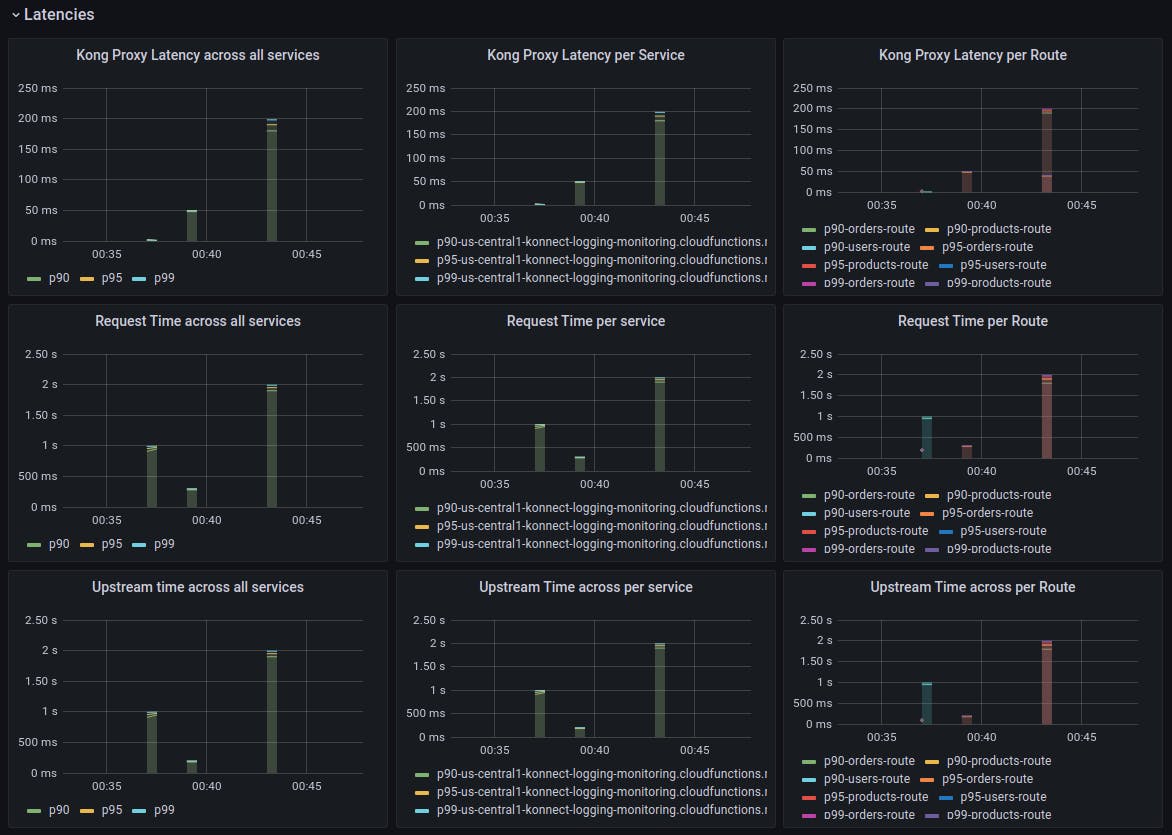
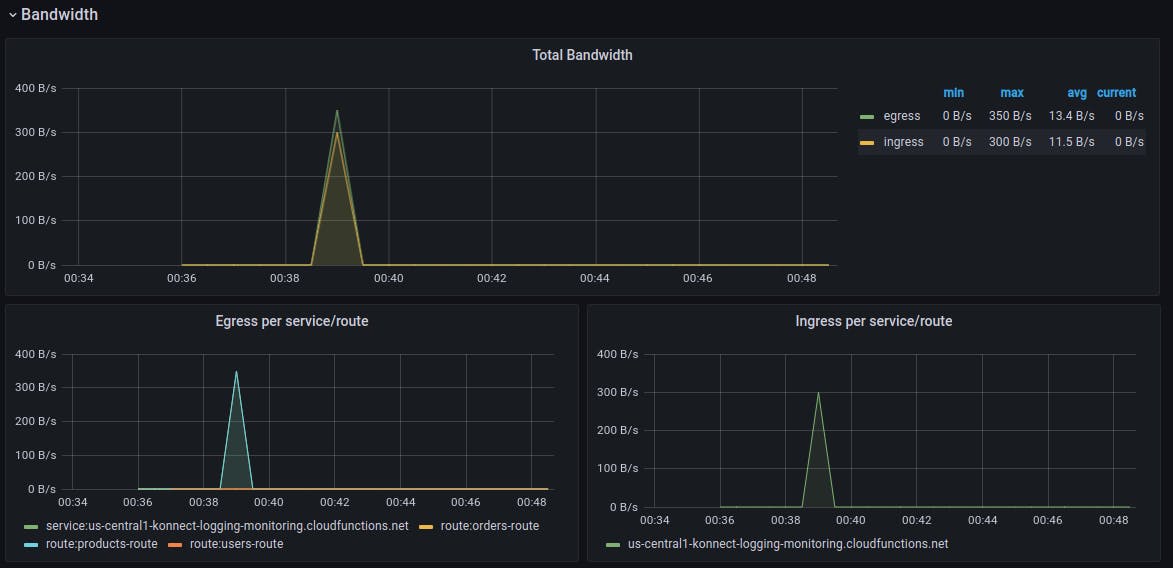
Now, Grafana is set up to look to Prometheus for its data and then display visualizations using Kong's dashboard.
Here are some beautiful visualizations of monitoring metrics from our three services, managed by Kong Konnect and accessed through Kong Gateway:
Microservices monitoring and metrics—done! However, let's not forget that we still need to hook our three services into a logging solution.
### Adding Logging
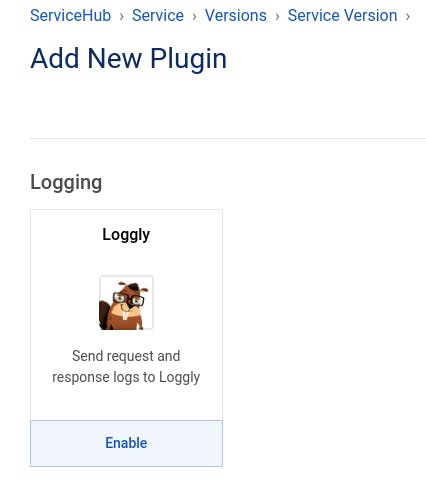
In Kong Konnect, we add the Loggly plugin to our services just like we did for Prometheus. First, we navigate to our service and version, and then we click on *New Plugin*. We search for the Loggly plugin and enable it.
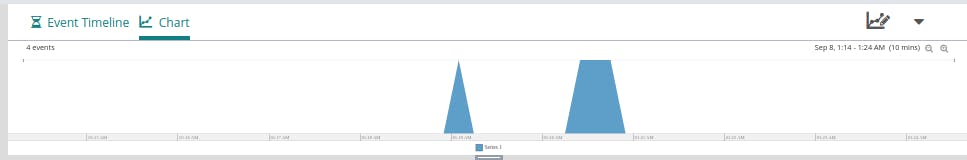
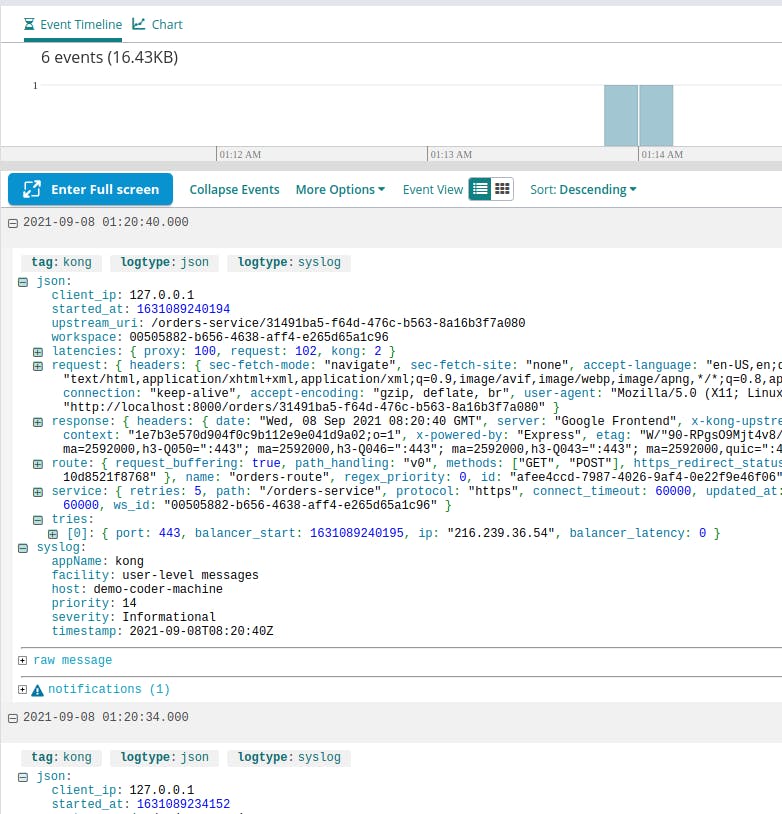
After making a few requests to our services, we can check the Log Explorer at Loggly to see what has shown up. We see some new, recent entries based on our recent requests:
## The Easy Path to Microservices Monitoring and Logging
If your organization values high-velocity and high-quality software development, this means moving away from error-prone and time-consuming manual processes. You shouldn't leave simple must-haves like microservices monitoring and l
Monitoring and distributed tracing enable observability of your production system and contribute to the feedback loop for a more efficient and effective development process. Monitoring Microservices Monitoring the health of your production system in
In this post, we'll talk about what API SecOps is, including the fundamentals of it and the personas involved. Then, we'll discuss how API, microservice, and policy lifecycles integrate to produce a secure service in production, and why collaboratio
Danny Freese
# Building End to End Observability in Kong Konnect Infrastructure
As infrastructure becomes more and more distributed, building better observability around it is becoming crucial. With the emergence of microservices architecture, teams want to gain better visibility with proper observability built into the archite
Deepak Mohandas
# Observability For Your Microservices Using Kong and Kubernetes
Read the latest version: APM With Prometheus and Grafana on Kubernetes Ingress Archived post below. In the modern SaaS world, observability is key to running software reliability, managing risks and deriving business value out of the code that you'
Harry Bagdi
# Built-in Health Checks for High Availability Microservices
Developers are turning to microservices in greater numbers to help break through the inflexibility of old monolithic applications. Microservices offer many benefits, including separation of concerns, team autonomy, fault tolerance, and scaling acr
Hisham Muhammad
# Beyond Static Routing: Modernizing API Logic with Conditional Policy Execution
Imagine you have a single Service, order-api . You want to apply a strict rate limit to most traffic, but you want to bypass that limit—or apply a different one—if the request contains a specific X-App-Priority: High header. Previously, you had t
Hugo Guerrero
# 5 Best Practices for Securing AI Microservices at Scale in 2026
The Stakes Keep Rising
The security implications are severe. OWASP's 2025 Top 10 for LLM Applications ranks prompt injection as the number one critical vulnerability. Attackers manipulate LLM inputs to override instructions, extract sensitive data,
Kong
# Microservices Monitoring and Distributed Tracing Tools
Monitoring and distributed tracing enable observability of your production system and contribute to the feedback loop for a more efficient and effective development process. Monitoring Microservices Monitoring the health of your production system in
In this post, we'll talk about what API SecOps is, including the fundamentals of it and the personas involved. Then, we'll discuss how API, microservice, and policy lifecycles integrate to produce a secure service in production, and why collaboratio
Danny Freese
# Building End to End Observability in Kong Konnect Infrastructure
As infrastructure becomes more and more distributed, building better observability around it is becoming crucial. With the emergence of microservices architecture, teams want to gain better visibility with proper observability built into the archite
Deepak Mohandas
# Observability For Your Microservices Using Kong and Kubernetes
Read the latest version: APM With Prometheus and Grafana on Kubernetes Ingress Archived post below. In the modern SaaS world, observability is key to running software reliability, managing risks and deriving business value out of the code that you'
Harry Bagdi
# Built-in Health Checks for High Availability Microservices
Developers are turning to microservices in greater numbers to help break through the inflexibility of old monolithic applications. Microservices offer many benefits, including separation of concerns, team autonomy, fault tolerance, and scaling acr
Hisham Muhammad
# Beyond Static Routing: Modernizing API Logic with Conditional Policy Execution
Imagine you have a single Service, order-api . You want to apply a strict rate limit to most traffic, but you want to bypass that limit—or apply a different one—if the request contains a specific X-App-Priority: High header. Previously, you had t
Hugo Guerrero
# 5 Best Practices for Securing AI Microservices at Scale in 2026
The Stakes Keep Rising
The security implications are severe. OWASP's 2025 Top 10 for LLM Applications ranks prompt injection as the number one critical vulnerability. Attackers manipulate LLM inputs to override instructions, extract sensitive data,
Kong
## Ready to see Kong in action?
Get a personalized walkthrough of Kong's platform tailored to your architecture, use cases, and scale requirements.