We're excited to announce the general availability of Konnect Debugger, formerly known as Active Tracing during its tech preview phase. This powerful debugging and observability solution in Kong Konnect has evolved from a focused tracing tool into a comprehensive debugging platform.
Konnect Debugger retains all the great capabilities you loved from Active Tracing while expanding to provide unprecedented visibility into API traffic, now combining detailed tracing and comprehensive logging to empower you to optimize performance, troubleshoot issues, and refine your API strategies with confidence.
The need for comprehensive debugging capabilities
Intermittent service issues can be elusive and challenging to understand. To ensure optimal performance and reliability, it’s essential to have a clear view into your service’s behavior. This is where comprehensive observability comes in — providing the ability to understand and contextualize system behavior even in the absence of known issues.
When critical services malfunction, pinpointing the root cause can be daunting. Is it a DNS issue, an upstream service anomaly, undetected failures, or a gateway problem? For platform operation teams, accessing component-level data and detailed logs is crucial for rapid mean time to resolution (MTTR).
However, generating and storing detailed telemetry data and logs continuously may be detrimental to the performance of the service and unnecessary. This is where targeted, on-demand insights become invaluable — enabling teams to swiftly identify and resolve issues, minimizing service disruptions.
From Active Tracing to Konnect Debugger
Building on the foundation of Active Tracing's powerful targeted tracing capabilities, Konnect Debugger represents the natural evolution of our observability offering. All the features you relied on in Active Tracing remain intact and enhanced:
- Same powerful tracing engine: Generate detailed OpenTelemetry-compatible traces on-demand
- Familiar sampling capabilities: Target specific services, routes, or requests with expression-based criteria
- Enhanced visualization: The same intuitive trace viewer you know, now with additional debugging views
- Zero additional instrumentation: Continue to get deep insights without changing your existing setup
What's new is the expanded scope: Konnect Debugger now combines these proven tracing capabilities with comprehensive logging, giving you a complete debugging solution in a single, integrated interface.
Introducing Konnect Debugger
With Konnect Debugger, infrastructure administrators can initiate targeted debugging sessions in specific API gateway nodes. During a debugging session, the selected gateway generates both detailed OpenTelemetry-compatible traces and comprehensive logs for all requests matching the sampling criteria. The detailed spans and log entries are captured for the entire request/response lifecycle. These traces and logs can be visualized with Konnect’s built-in debugging interface with no additional instrumentation or telemetry tools. Konnect’s Debugger offers exclusive, in-depth insights that can't be replicated by third-party observability tools.
By capturing detailed, component-level telemetry data and logs, platform operations teams can gain a deeper understanding of their services’ performance, dependencies, error conditions and potential bottlenecks. This targeted approach to observability enables teams to optimize their services, reduce uncertainty, and improve overall system reliability.
Key highlights
- All your favorite Active Tracing features:
- Debug sessions can be initiated for a service (includes all routes) or per route
- Traces and logs can be generated for all requests or those matching sampling criteria
- Sampling criteria can be defined with simple expressions language (ex: http.method == "GET")
- Trace spans and attributes adhere to OpenTelemetry conventions
- Sessions are retained in Konnect for up to 7 days
- Enhanced with comprehensive logging:
- Comprehensive request/response logs
- Seamless correlation between traces and logs for comprehensive analysis
- Enhanced debugging interface with integrated logs view
- Same powerful visualization, now expanded:
- Traces and logs can be visualized in Konnect's built-in debugging interface
- Familiar trace viewer enhanced with additional debugging capabilities
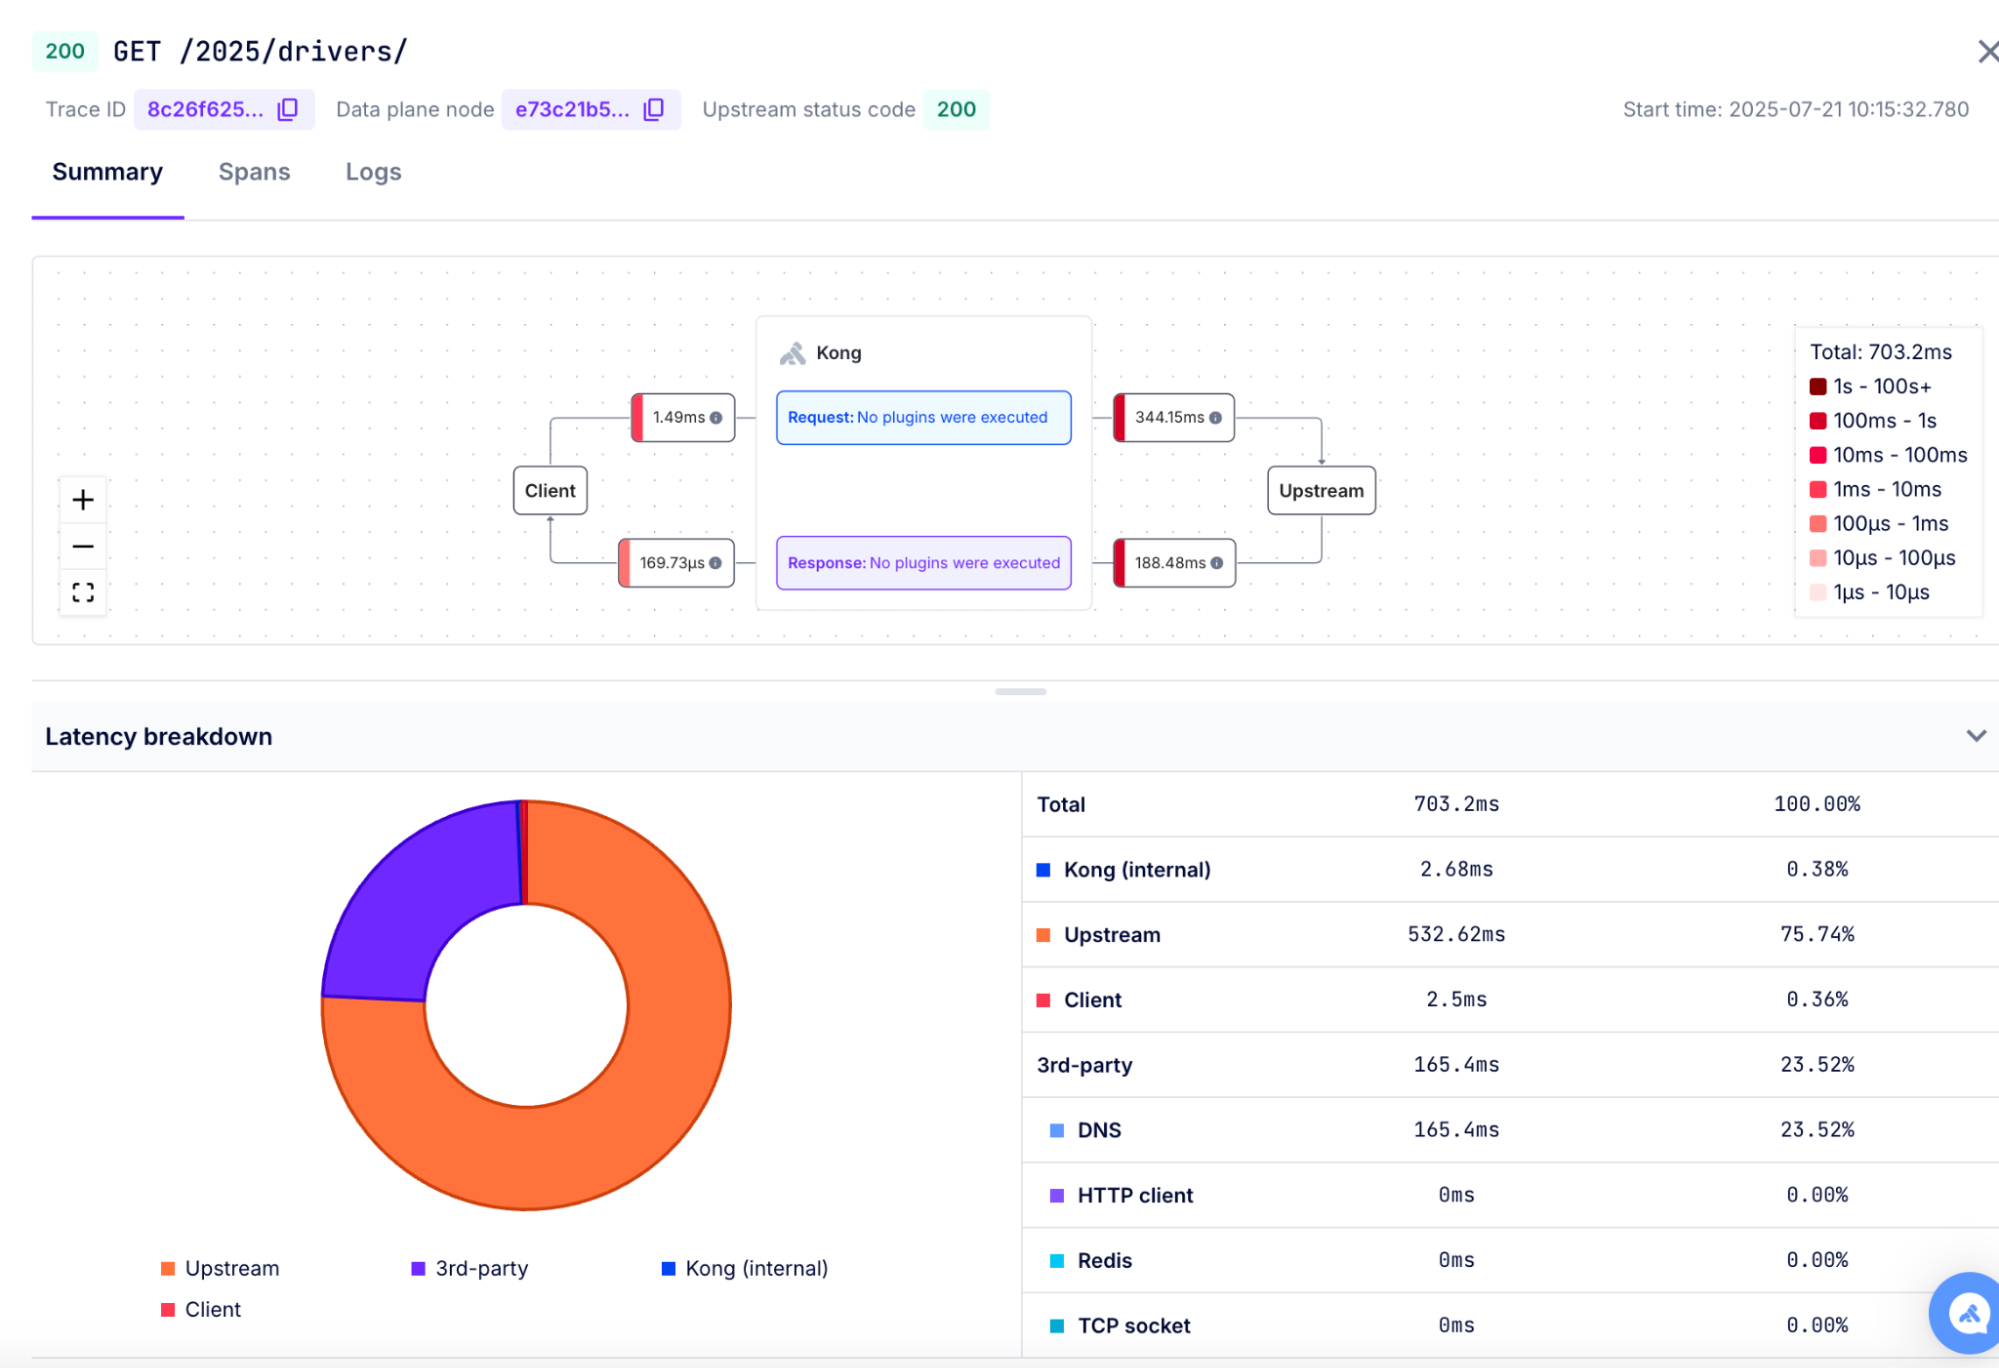
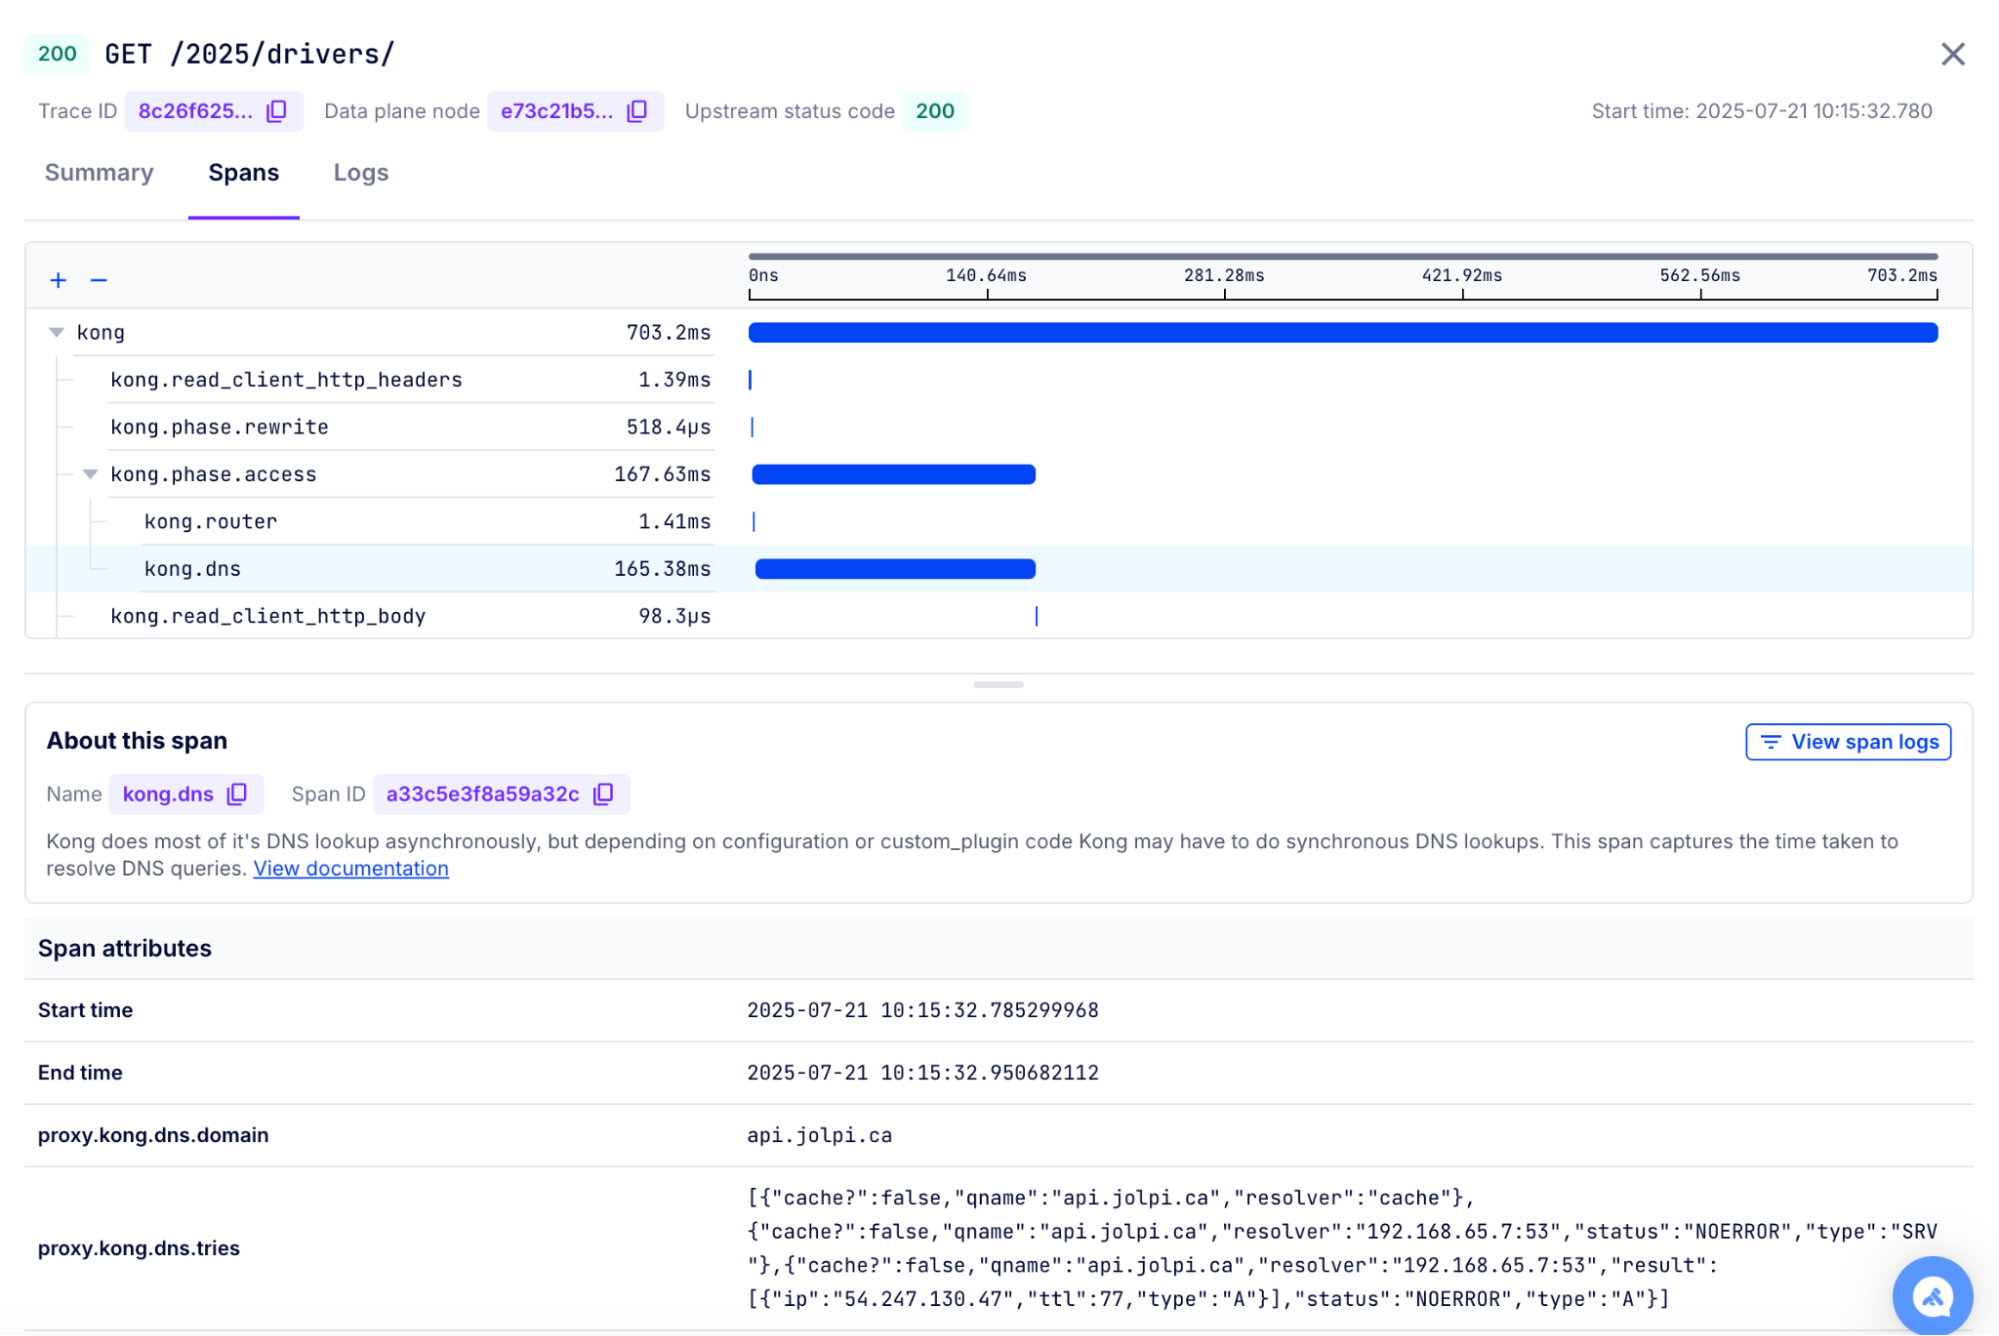
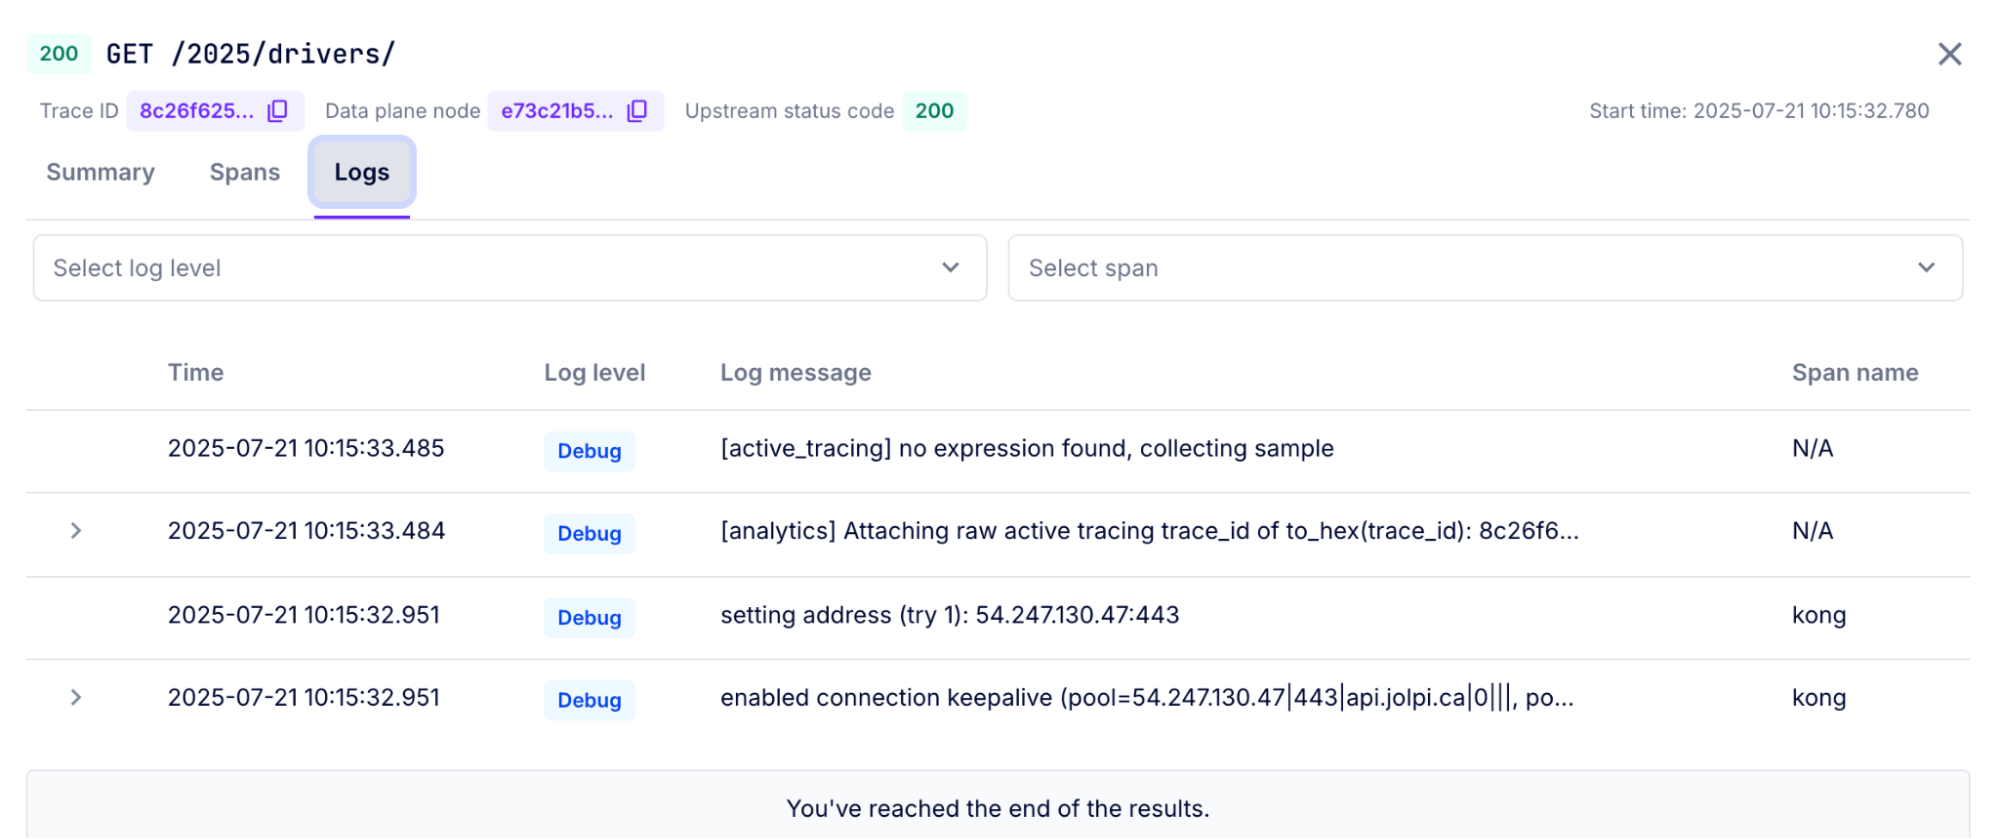
Traces and logs captured in a Konnect Debugger session can be visualized in Konnect's built-in debugging interface. The debugger provides a summary view, trace view, and logs view. You can gain instant insights with the summary view, dive deeper with the trace view, and examine detailed execution logs for comprehensive troubleshooting.
Gain instance insights with summary view
Summary view helps you visualize the entire API request-response flow in a single glance. This view provides a concise overview of critical metrics, error indicators, and a transaction map. The transaction map includes the plugins executed by Kong on both the request and the response, along with the times spent in each phase. Use summary view to quickly understand the end-to-end API flow, identify performance bottlenecks, spot errors, and optimize your API strategy.


