### Konnect Service Catalog: 360 Service Visibility
Service owners and application teams waste a lot of time tracking down critical information about a service across various developer toolchains, triggering unnecessary cognitive load and slowing down their productivity. To help developers self-service the information they need and unblock development progress, Service Catalog aggregates critical information across third-party systems to provide an up-to-date 360-degree view of each registered service in one place. This includes necessary information like code repositories, CI/CD pipelines, on-call rotations, and more.
Since Service Catalog was released in beta, we’ve been enriching this feature with Konnect-specific and third-party integrations that unlock the following capabilities:
### New Konnect Developer Portal
If you want to surface the right APIs to tailored consumer audiences, you need a developer portal. For organizations looking to productize their APIs, a developer portal is critical to facilitating API adoption. And while they’ve historically served as the solution for API discovery and adoption, many solutions out there today are clunky and don’t step up to the needs of the modern developer experience. Poor DevEx means developers won’t use the portal to discover APIs or adopt them. This hampers their ability to innovate and deliver products quickly and the ROI from the portal itself.
We’ve set out to change that with the public beta version of our newly reimagined [Kong Konnect Developer Portal](https://konghq.com/products/kong-konnect/features/developer-portal)Kong Konnect Developer Portal, which we built with a top-notch DevEx at its core. Read all about it in [this blog post](https://konghq.com/blog/product-releases/new-konnect-dev-portal)this blog post.
### Actionable visibility into your API traffic
Whether you’re a platform engineer, a developer, or an API product manager, if you’re responsible in any way for the day-to-day management of APIs, you likely want to understand all the activity happening at the gateway level, such as metrics around API usage, performance, and health. Having real-time, granular observability into your APIs allows you to pinpoint and resolve any issues quickly, so you can ensure optimal API performance and minimize service disruptions.
Since the analytics experience is well-embedded in Gateway Manager, Dev Portal, and Service Catalog, you automatically get high-level visualizations and charts of relevant API metrics in real time across the Konnect platform. To enhance the troubleshooting flow from these various parts of Konnect, we’ve improved the ability to explore these charts in deeper detail.
Let’s say you’re looking at the API traffic status codes for a specific service in Gateway Manager. You notice a spike in 500s in the past hour and want to dig deeper to understand what’s happening. To drill down further, you can now click the chart in question and be directed to the Analytics Explorer view with the chart’s data and context preserved.
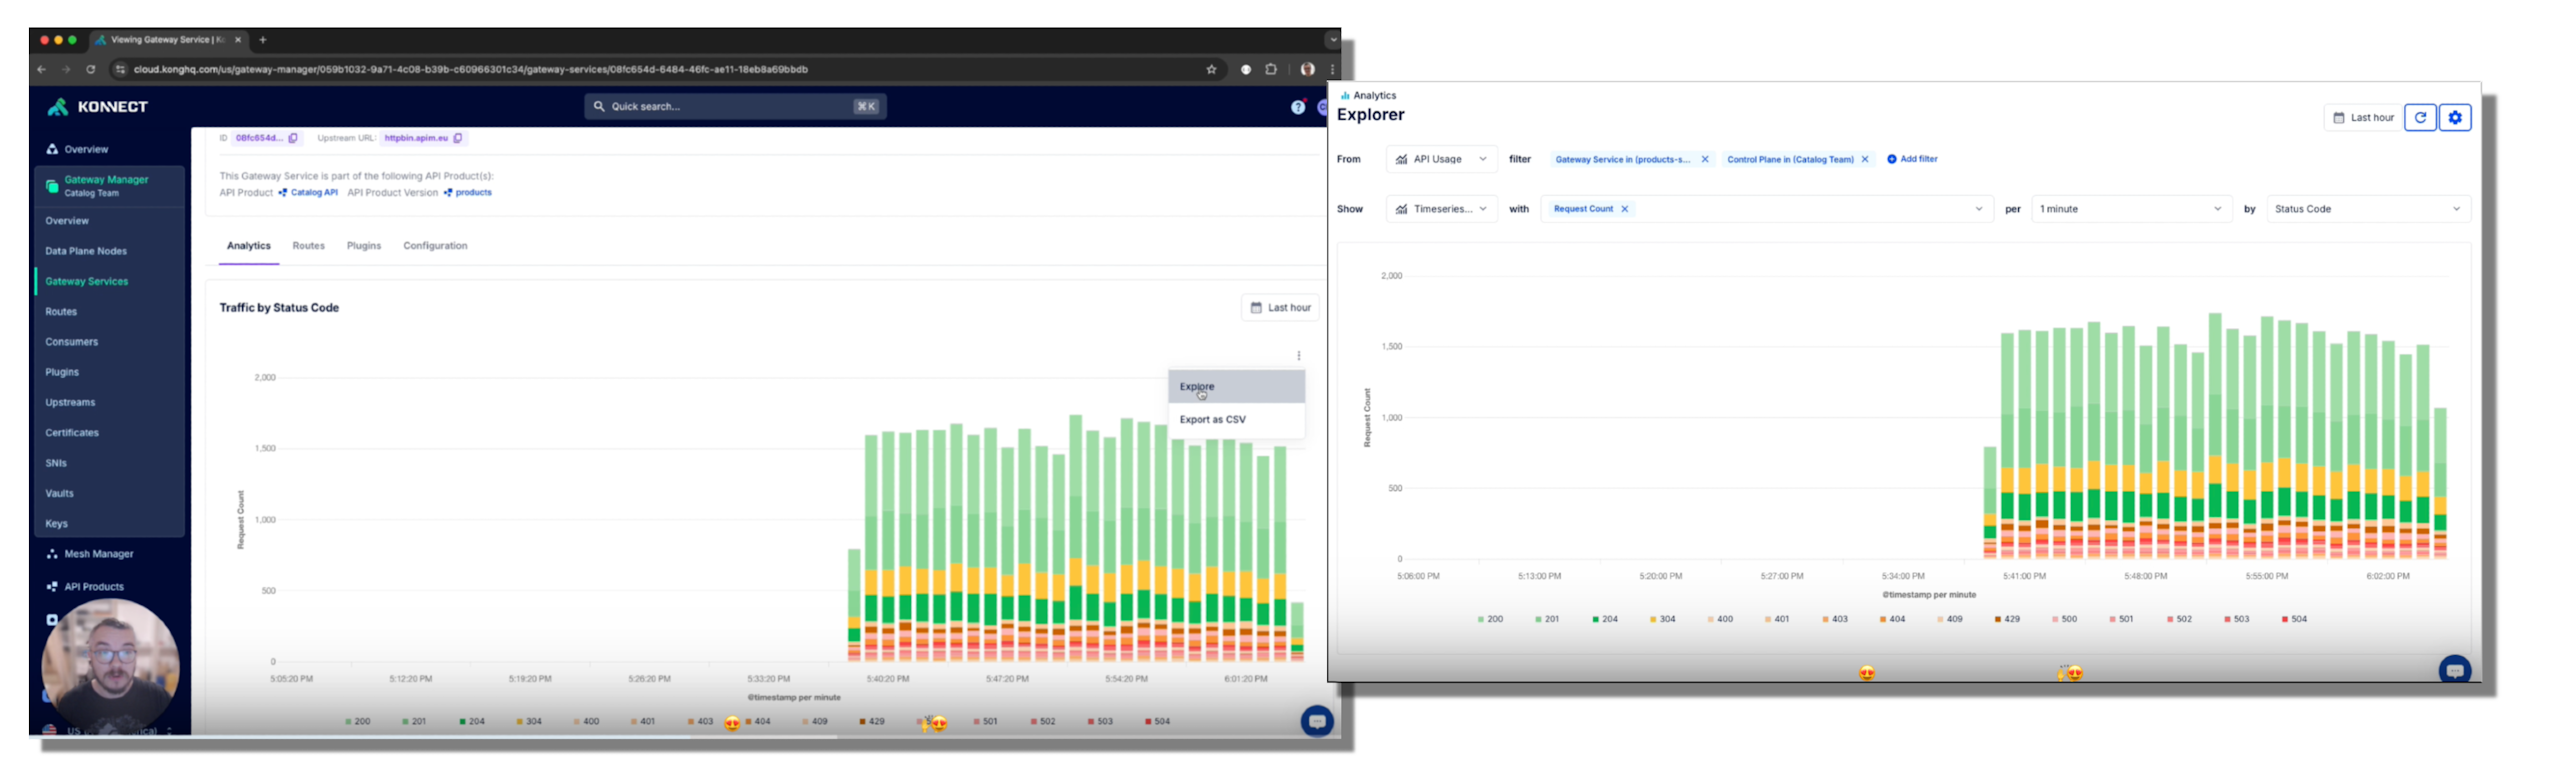
*This “Jump to Explorer” ability extends to every live chart in Konnect and allows you to drill down into information, investigate anomalies, and understand impact in a streamlined way. *
### Active Tracing
Now, let’s say you need to go even deeper than a chart. You want to pinpoint the root cause of a critical service malfunction — what’s causing the problem in the gateway? While collecting highly detailed telemetry data for all API traffic can be cost-prohibitive and challenging to implement, having a way to access a targeted slice of telemetry on-demand can prove extremely useful to platform teams for deeper understanding and rapid resolution.
For these types of focused troubleshooting scenarios, we’ve introduced a new feature called Active Tracing (currently in Tech Preview in Konnect). With Active Tracing, infrastructure administrators can generate a “deep tracing” session in targeted API gateway nodes, which then produces detailed traces for all requests matching the sampling criteria across the entire request/response lifecycle. You can view these traces directly in Konnect with a built-in span viewer. Read all about Active Tracing functionality in more detail in this [blog post](https://konghq.com/blog/product-releases/active-tracing-tech-preview)blog post.
Given the outsized impact APIs have on driving business value, we know how important it is for business stakeholders, typically non-technical users, to be able to access tailored API insights in order to make strategic decisions. With a user-friendly and intuitive UI, there is very little learning curve with Konnect Analytics, meaning users can self-service the insights they need for a specific service, route, or consumer with ease.
However, every organization has different priorities, and within organizations, some teams focus on consumer impact and health, while others hone in on runtime performance. These teams want to pull together and correlate data most relevant to their focus in a single dashboard, but the built-in dashboards in Konnect may not be the exact datasets most helpful to their cause.
We’re pumped to announce a brand-new feature in Analytics called **Custom Dashboards** (in tech preview) that allows users to build fully customized dashboards to consolidate key data in a single page and uncover relationships between data points. (Note that in order to start using the Custom Dashboards feature, you'll need to enable it via Konnect Labs.)
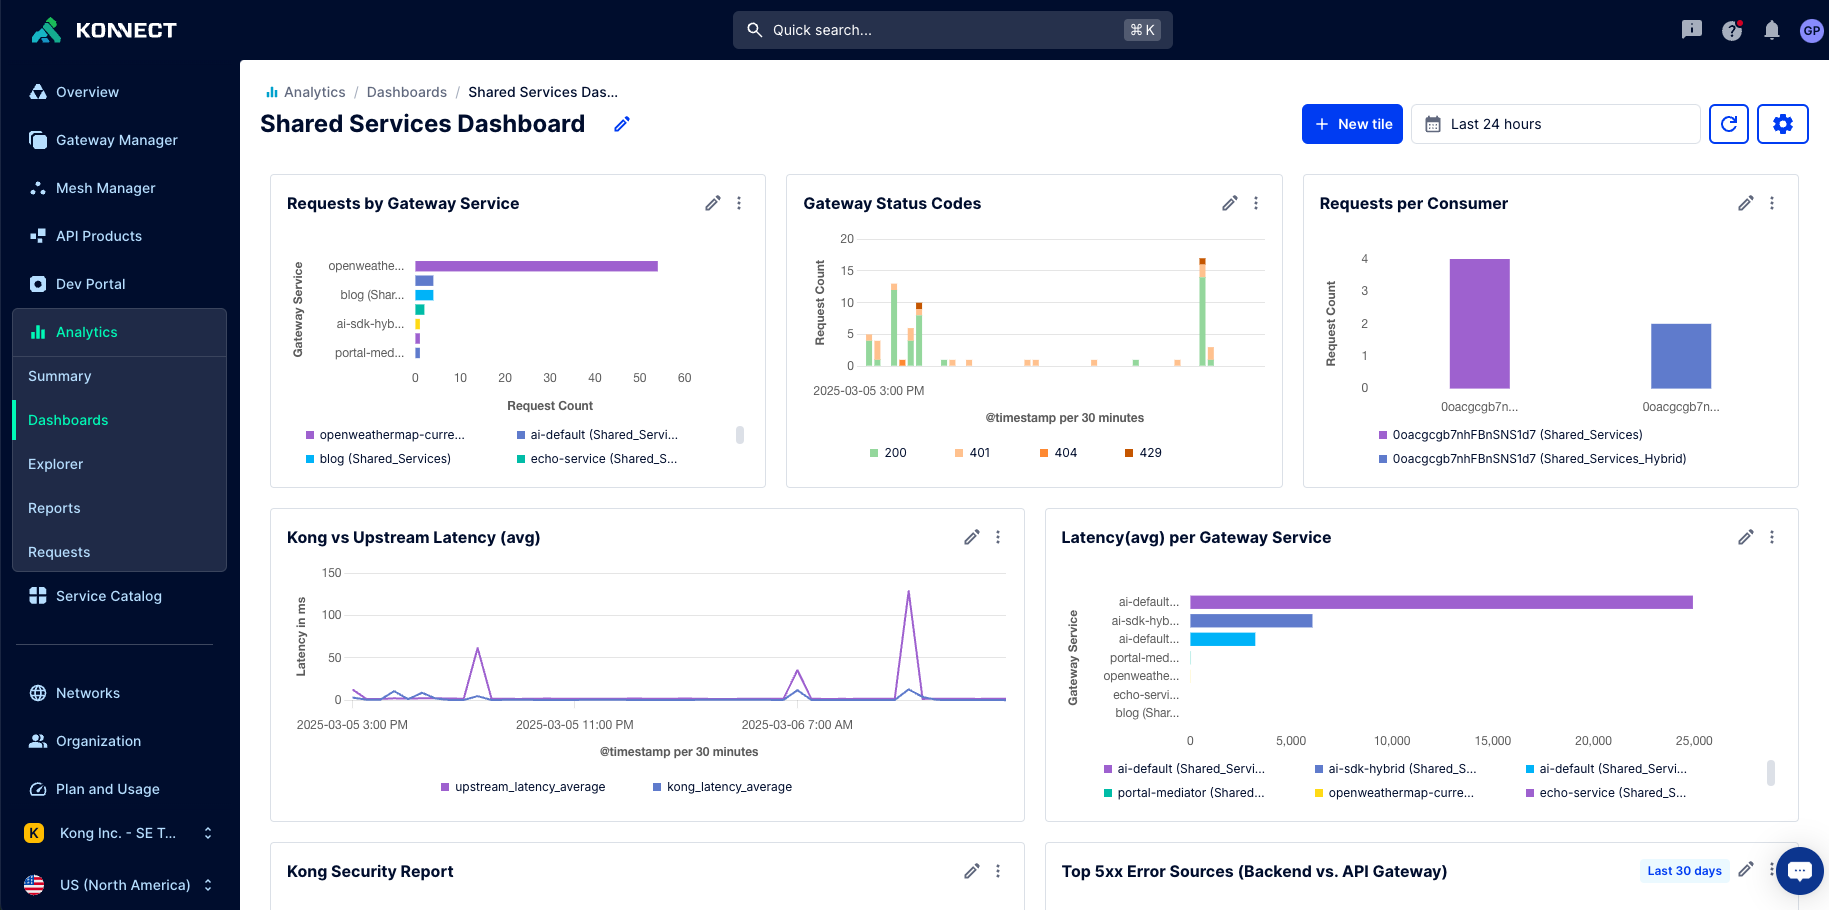
With Custom Dashboards, users can consolidate key metrics, usage trends, and error reports into a single dashboard for faster and more efficient decision-making. Custom dashboards are a great starting point for facilitating better communication around API strategy with both technical and non-technical stakeholders.
Check out the Custom Dashboards demo below to learn more.