
# Ensure API and AI performance with real-time observability
Monitor and optimize API and AI health with key metrics. Quickly resolve issues by tracing requests and agentic interactions to their root causes.
## Create an observability layer for APIs, AI, eventing, and microservices
- *
Build unified analytics and observability dashboards across traffic types.
- *
Trace complete AI sessions across models, tools, MCP servers, policies, and agents, not just individual requests.
- *
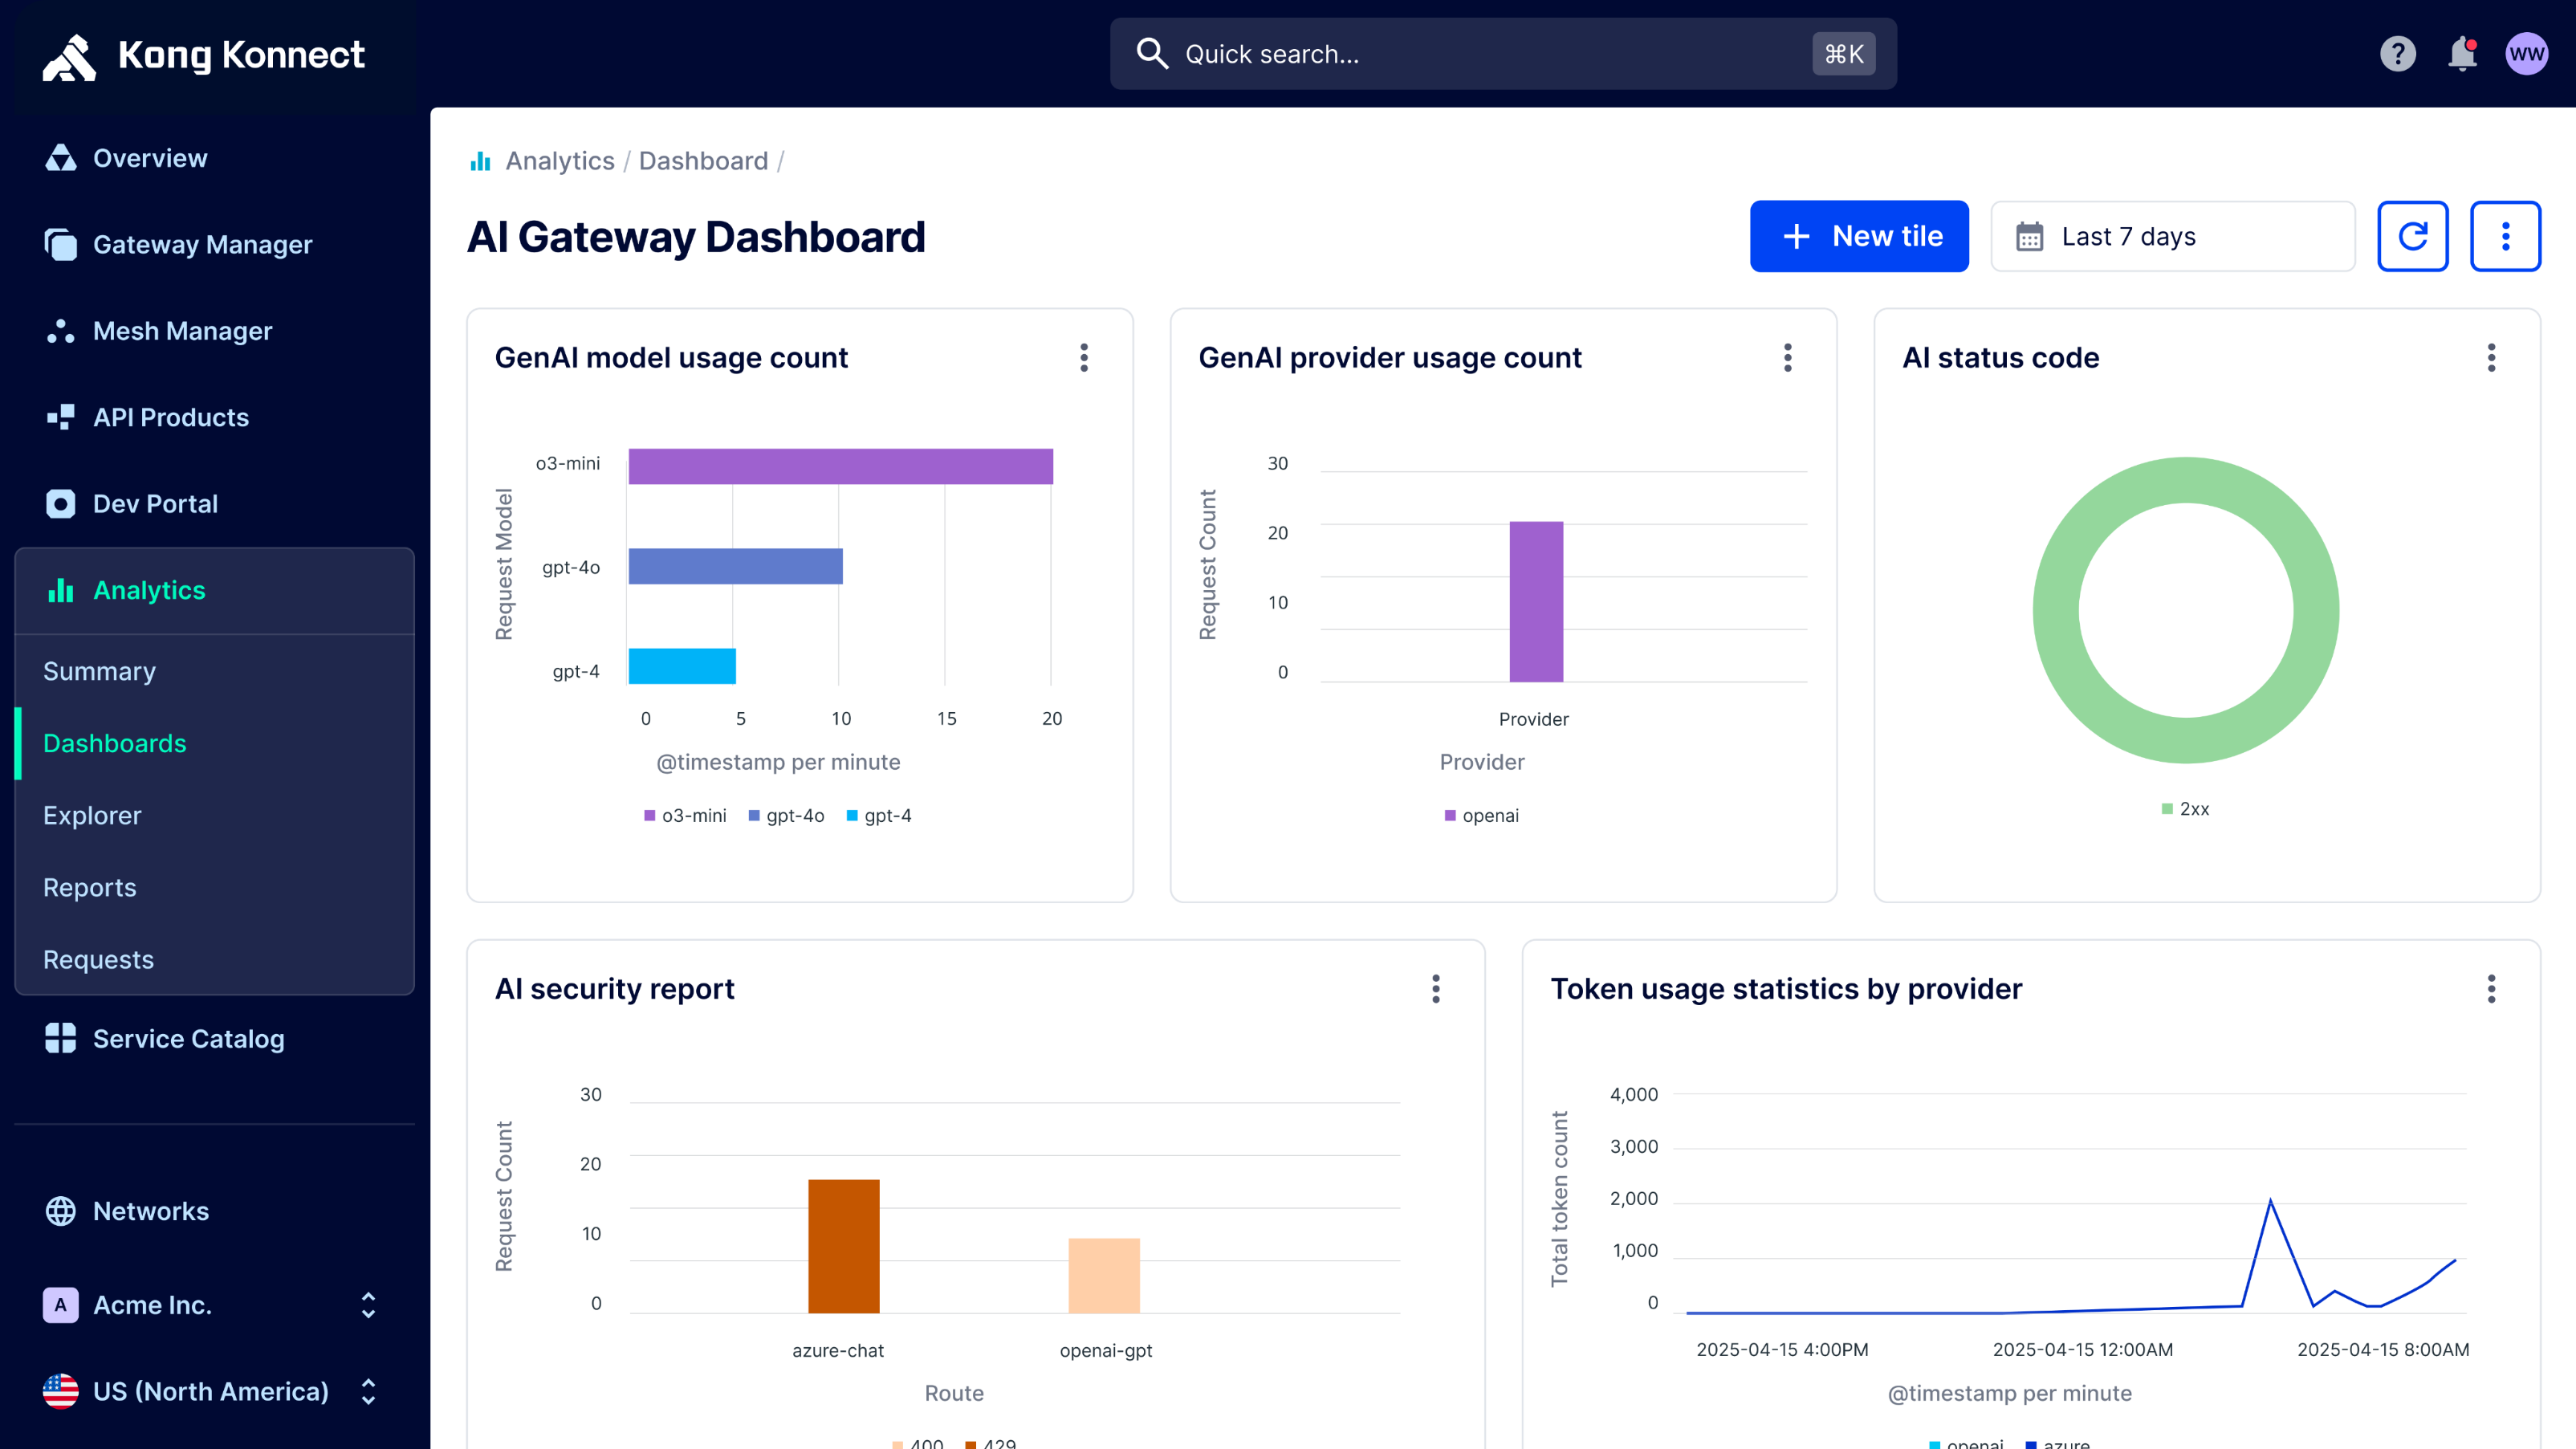
Control AI and LLM costs with dashboards that track cumulative token consumption, latency, and cost by model and by agent.
- *
Automate observability by enforcing Gateway observability policies globally, so every transaction is seen.

## Trace the session, not just the request
- *
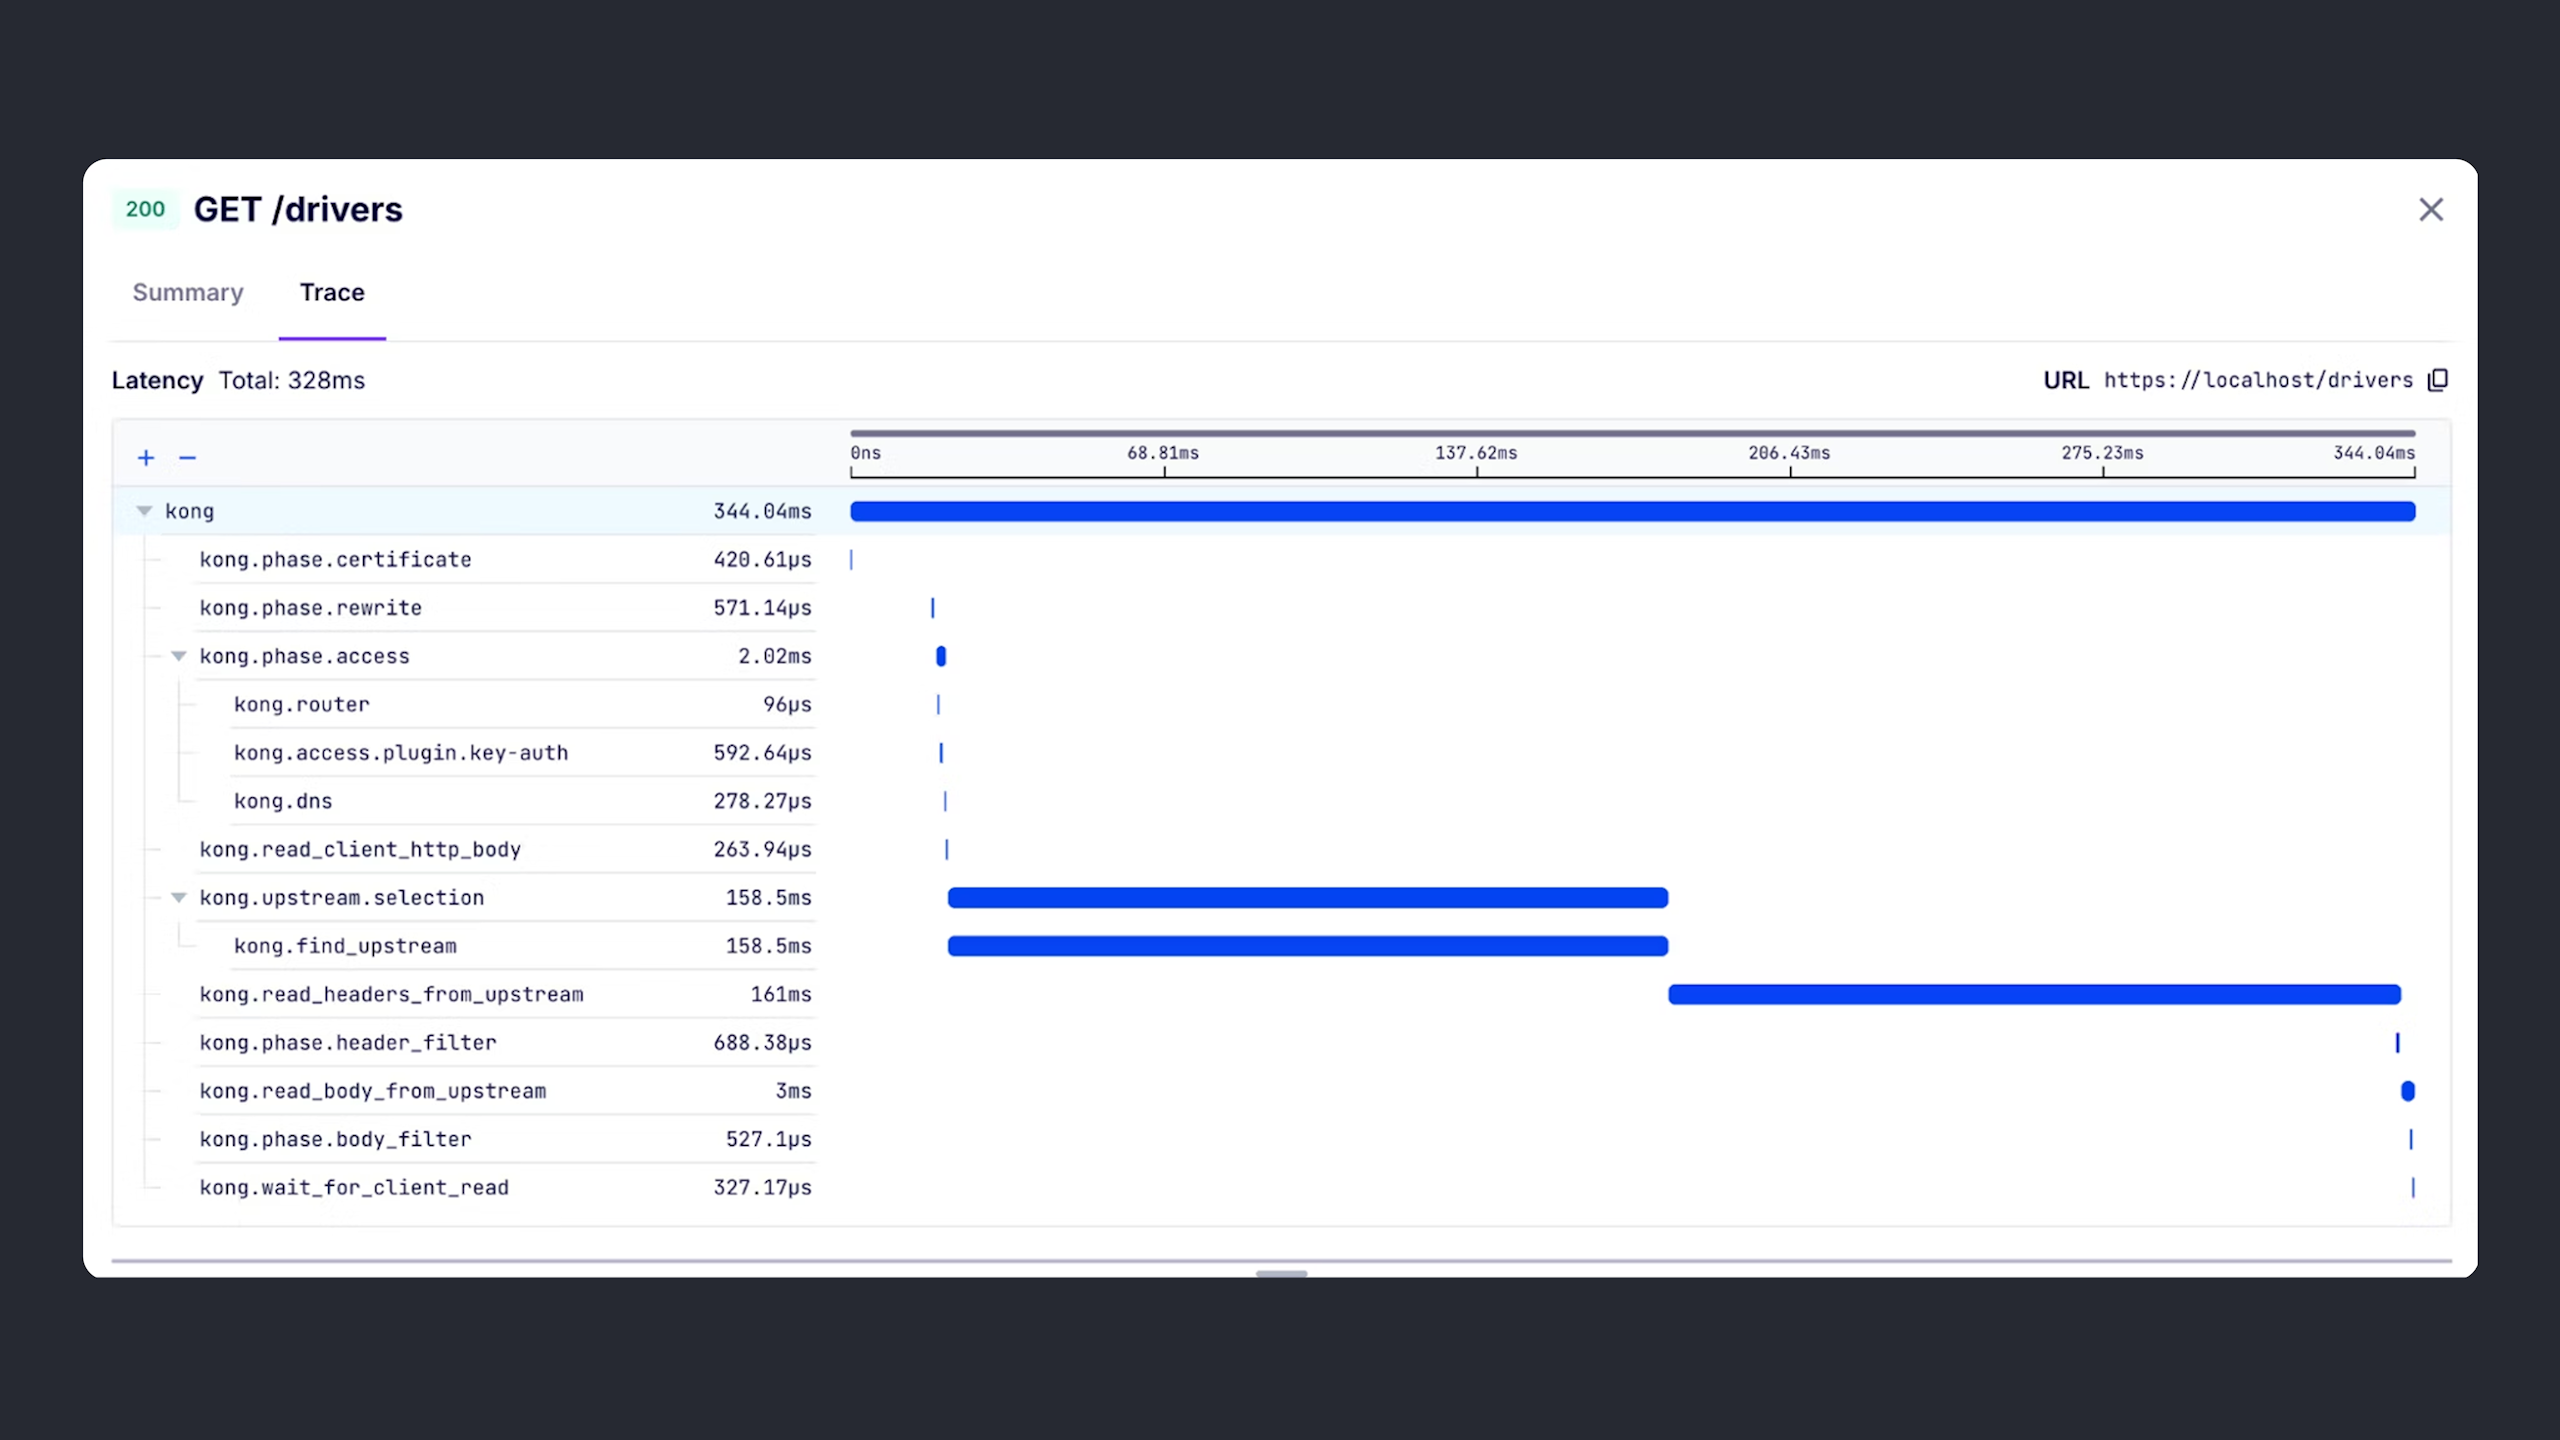
Trace individual API requests or follow complete AI sessions across models, tools, MCP servers, policies, and agents.
- *
Inspect the sequence of interactions — inputs, outputs, attributes, latency, token consumption, and failures — to understand where an AI workflow went wrong.
- *
Pinpoint root causes with visibility into request-response flows, plugin execution, and Kong's internal processing.
- *
Generate component-level telemetry to understand performance, dependencies, and bottlenecks across API and AI traffic.
## Pinpoint root causes fast with an AI copilot that already has the context
- *
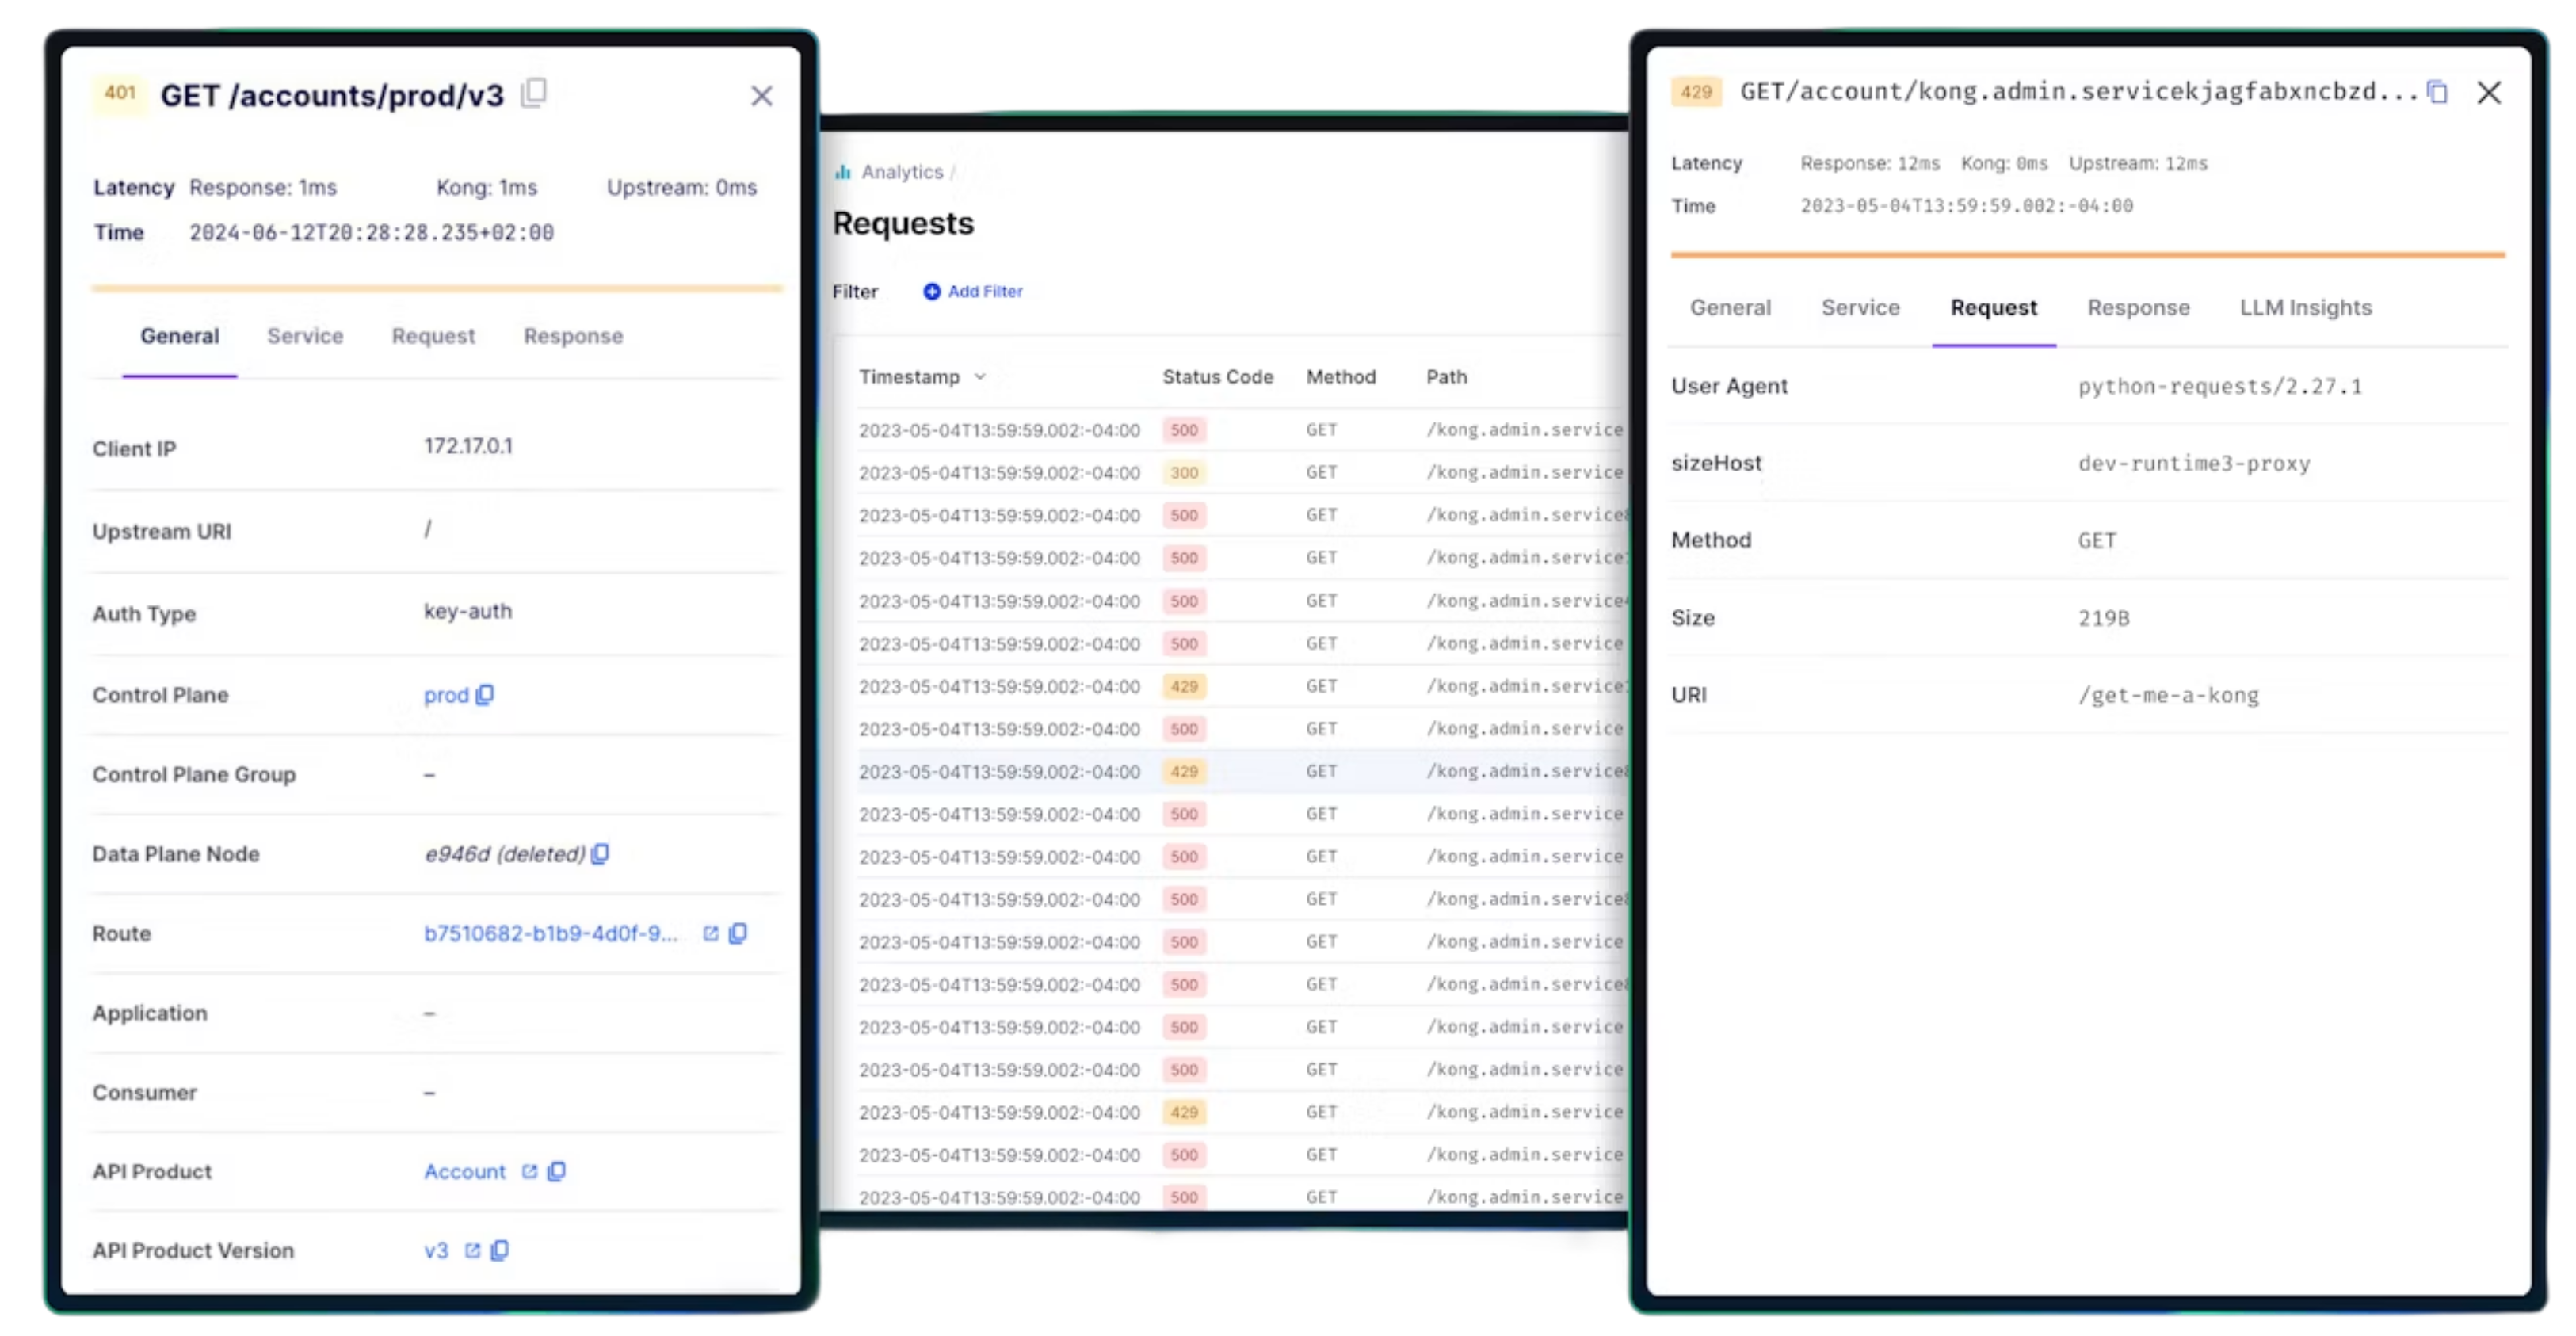
Start targeted debug sessions on gateway nodes and view summary, trace, and log views in Konnect's built-in debugger.
- *
Click "Analyze with KAi" on any trace and get root-cause analysis and remediation steps without leaving Konnect.
- *
Generate component-level telemetry across services, MCP tools, and event flows to understand dependencies and bottlenecks.
- *
Refine your configuration to stop issues from repeating.

## See exactly what your AI traffic costs
- *
Track token consumption by model, agent, team, and app in real time.
- *
Surface cost and latency trends across providers to catch runaway spend before it hits the bill.
- *
Feed AI cost and usage data into Konnect dashboards or export it via OTel to your platform of choice.

## Real-time visibility across your entire API estate
The metrics, logs, and integrations that keep your APIs, events, and services healthy in production.
### Real-time API monitoring to power excellent customer experiences
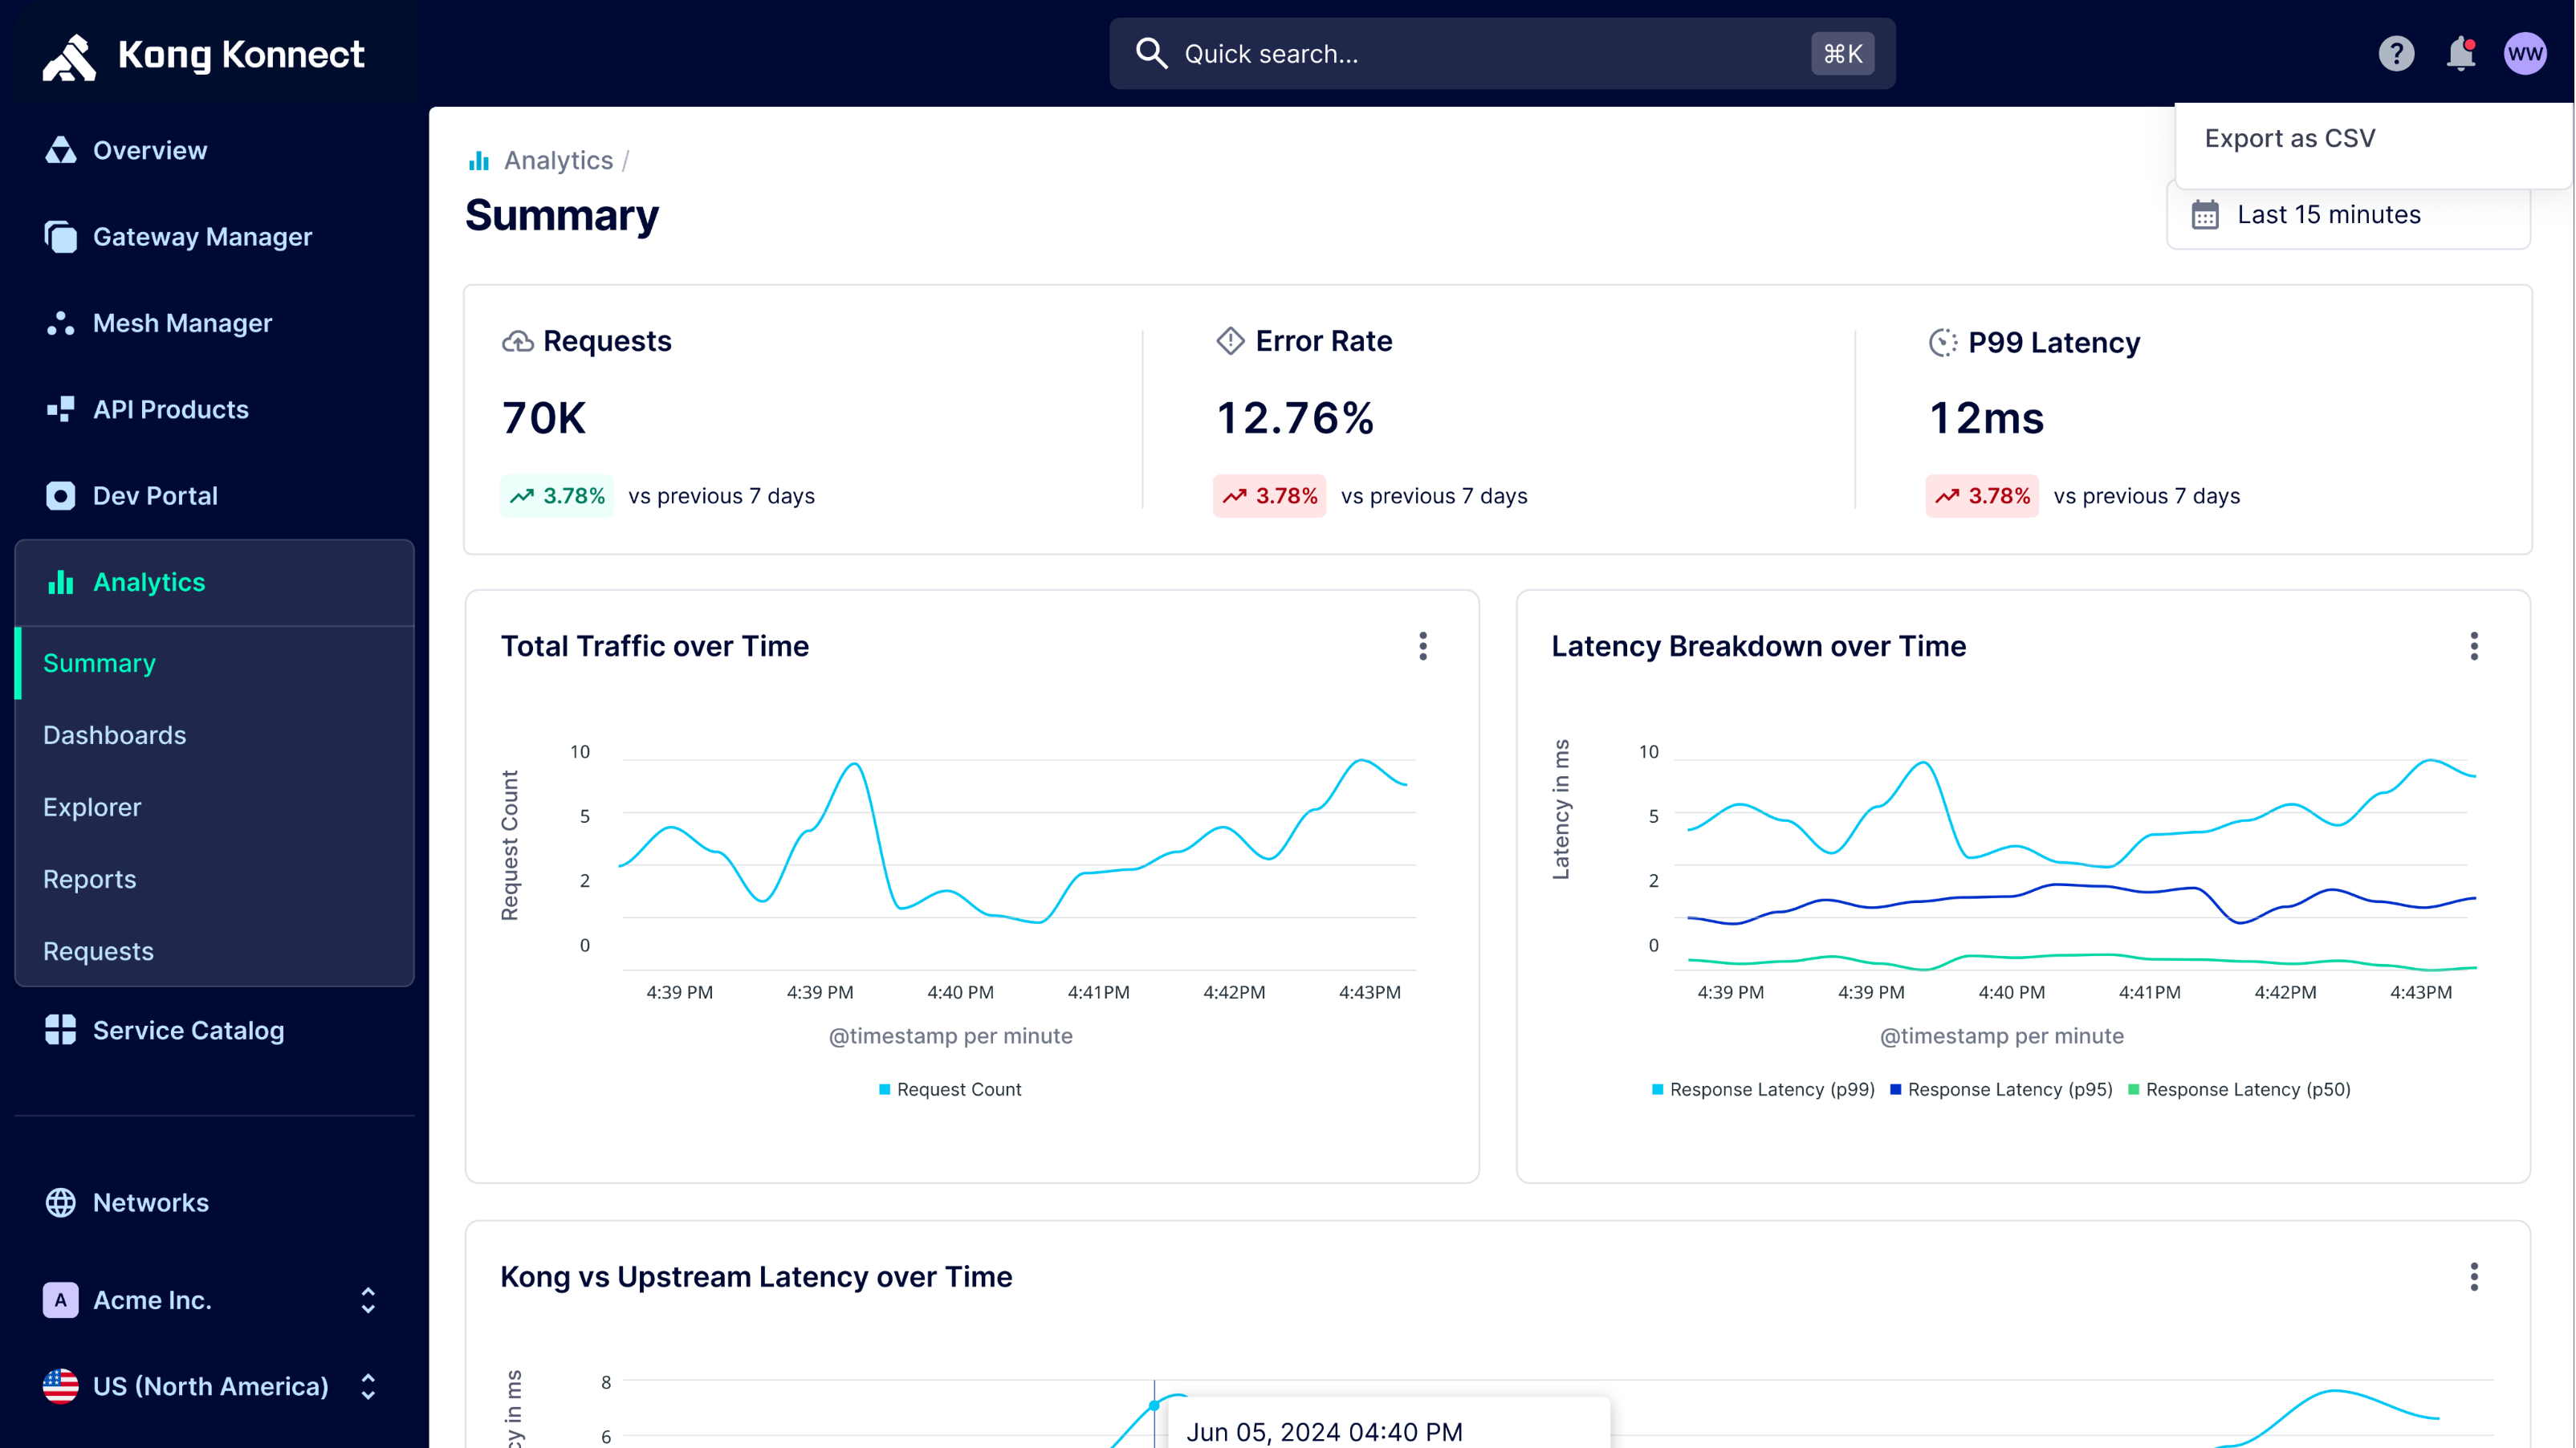
- - Drive unified visibility into API, AI, and Kafka performance and health.
- - Detect anomalies in request volume, error rates, average latency, and potential security risks in real time.
- - Drill into key metrics with interactive charts and time-based filters to accelerate issue resolution.
- - Uncover usage trends over time with custom reports to inform capacity planning and performance tuning.
### Continuously refine your API and AI programs with usage insights
- - See adoption and usage trends by product and consumer, and plan to know what's working.
- - Track version and deprecation impact so you retire old APIs and AI models without breaking active integrations.
- - Report on usage patterns to inform monetization, tiering, and roadmap decisions.
### Flexible implementation and enterprise-grade support
- - Flexibility to deploy on local or managed Kubernetes clusters.
- - Includes plugins for authentication, security, traffic control, transformations, analytics, and more.
- - Comes with 24x7 support for production-grade deployment.
### Build the API and AI observability strategy that suits your needs
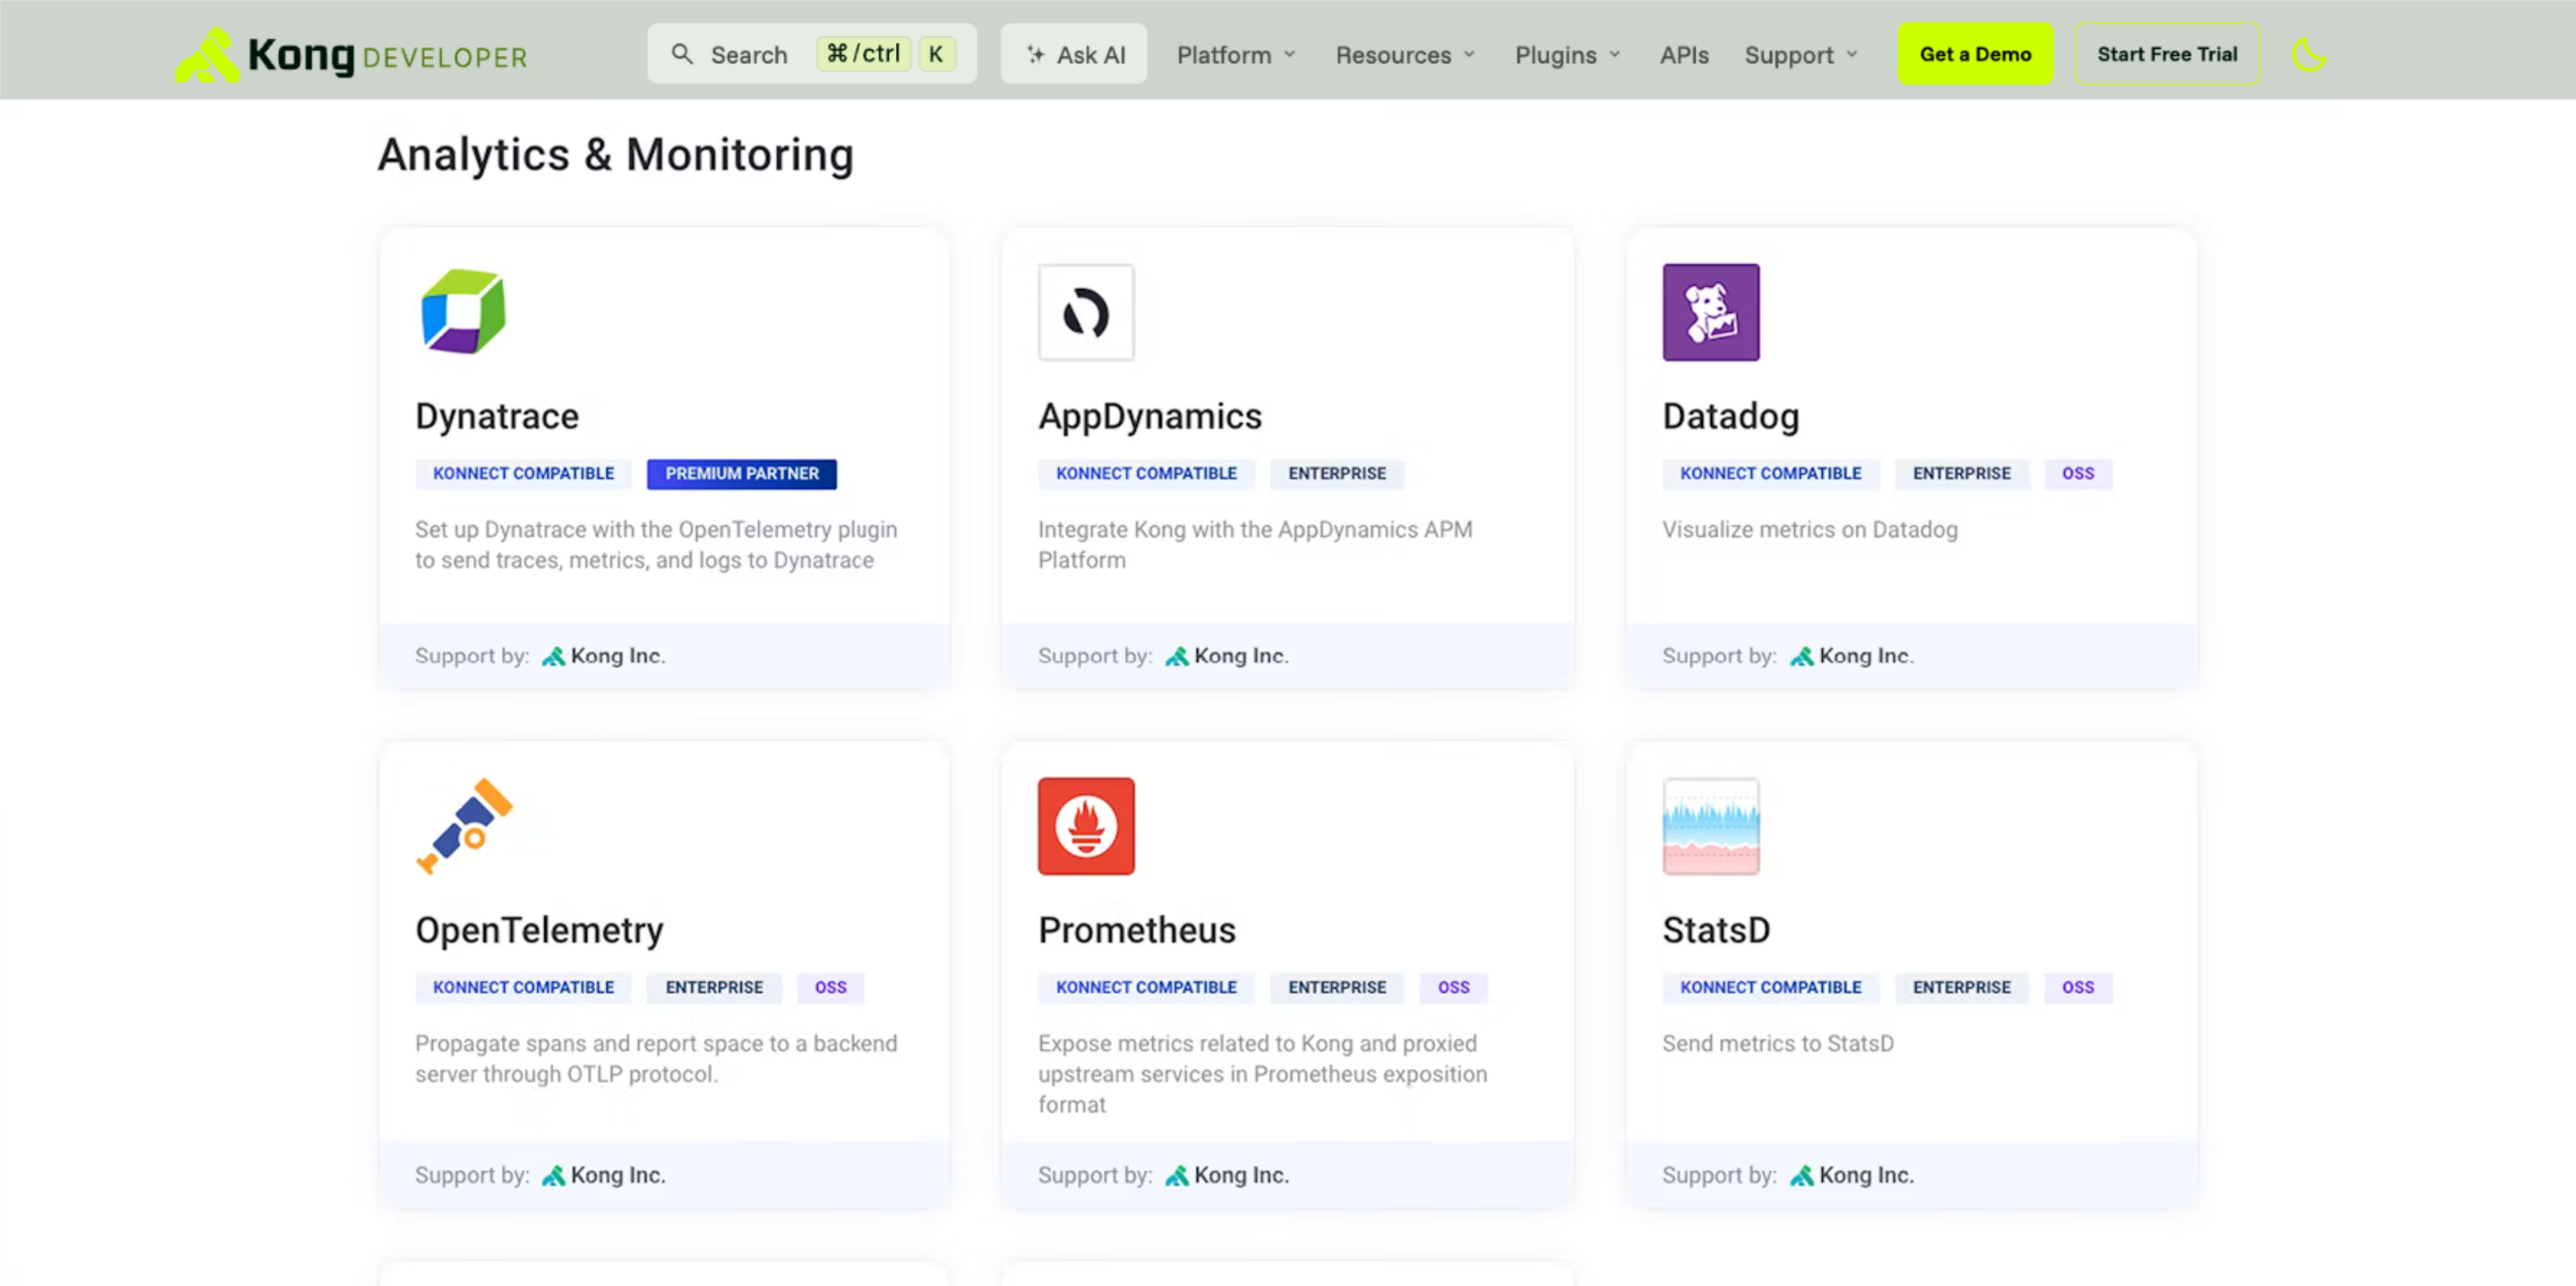
- - View observability and analytics dashboards directly in Konnect and/or send OTel-native logs, metrics, and traces to Dynatrace, Datadog, Grafana, Prometheus, or another platform of choice.
- - Send request and response logs to third-party systems such as Kafka, Syslog, and more.