_Blog_
[__# Ensure API and AI performance with real-time observability
Monitor and optimize API health with key metrics, and quickly resolve issues by tracing them to their root causes.
### Faster issue detection and resolution
Reduce your mean-time-to-detect (MTTD) and mean-time-to-resolve (MTTR) with real-time monitoring, API access logs, and deep, targeted traces — minimizing downtime and protecting the customer experience.
### Improve operational efficiency
Stay on top of traffic patterns, error rates, and bottlenecks to optimize your API performance and infrastructure, strengthen security, and reduce unnecessary resource usage and costs.
### Make informed, strategic API decisions
Make smarter product and business decisions with deep API insights that guide when to scale, invest, or deprecate APIs.
## API platform-wide monitoring and observability
Fine-tune your API performance and strategy with granular, contextual API insights across your API estate.
_01/ Multi-Runtime, Multi-Protocol_
## Create an observability layer for APIs, AI, eventing, and microservices
- - Build analytics and observability dashboards for API, AI, event streaming, and microservices traffic.
- - Control AI and LLM costs with dashboards that track LLM token consumption.
- - Automate observability by enforcing Gateway observability policies globally — ensuring every API transaction is seen.

_02/ Application API Metrics_
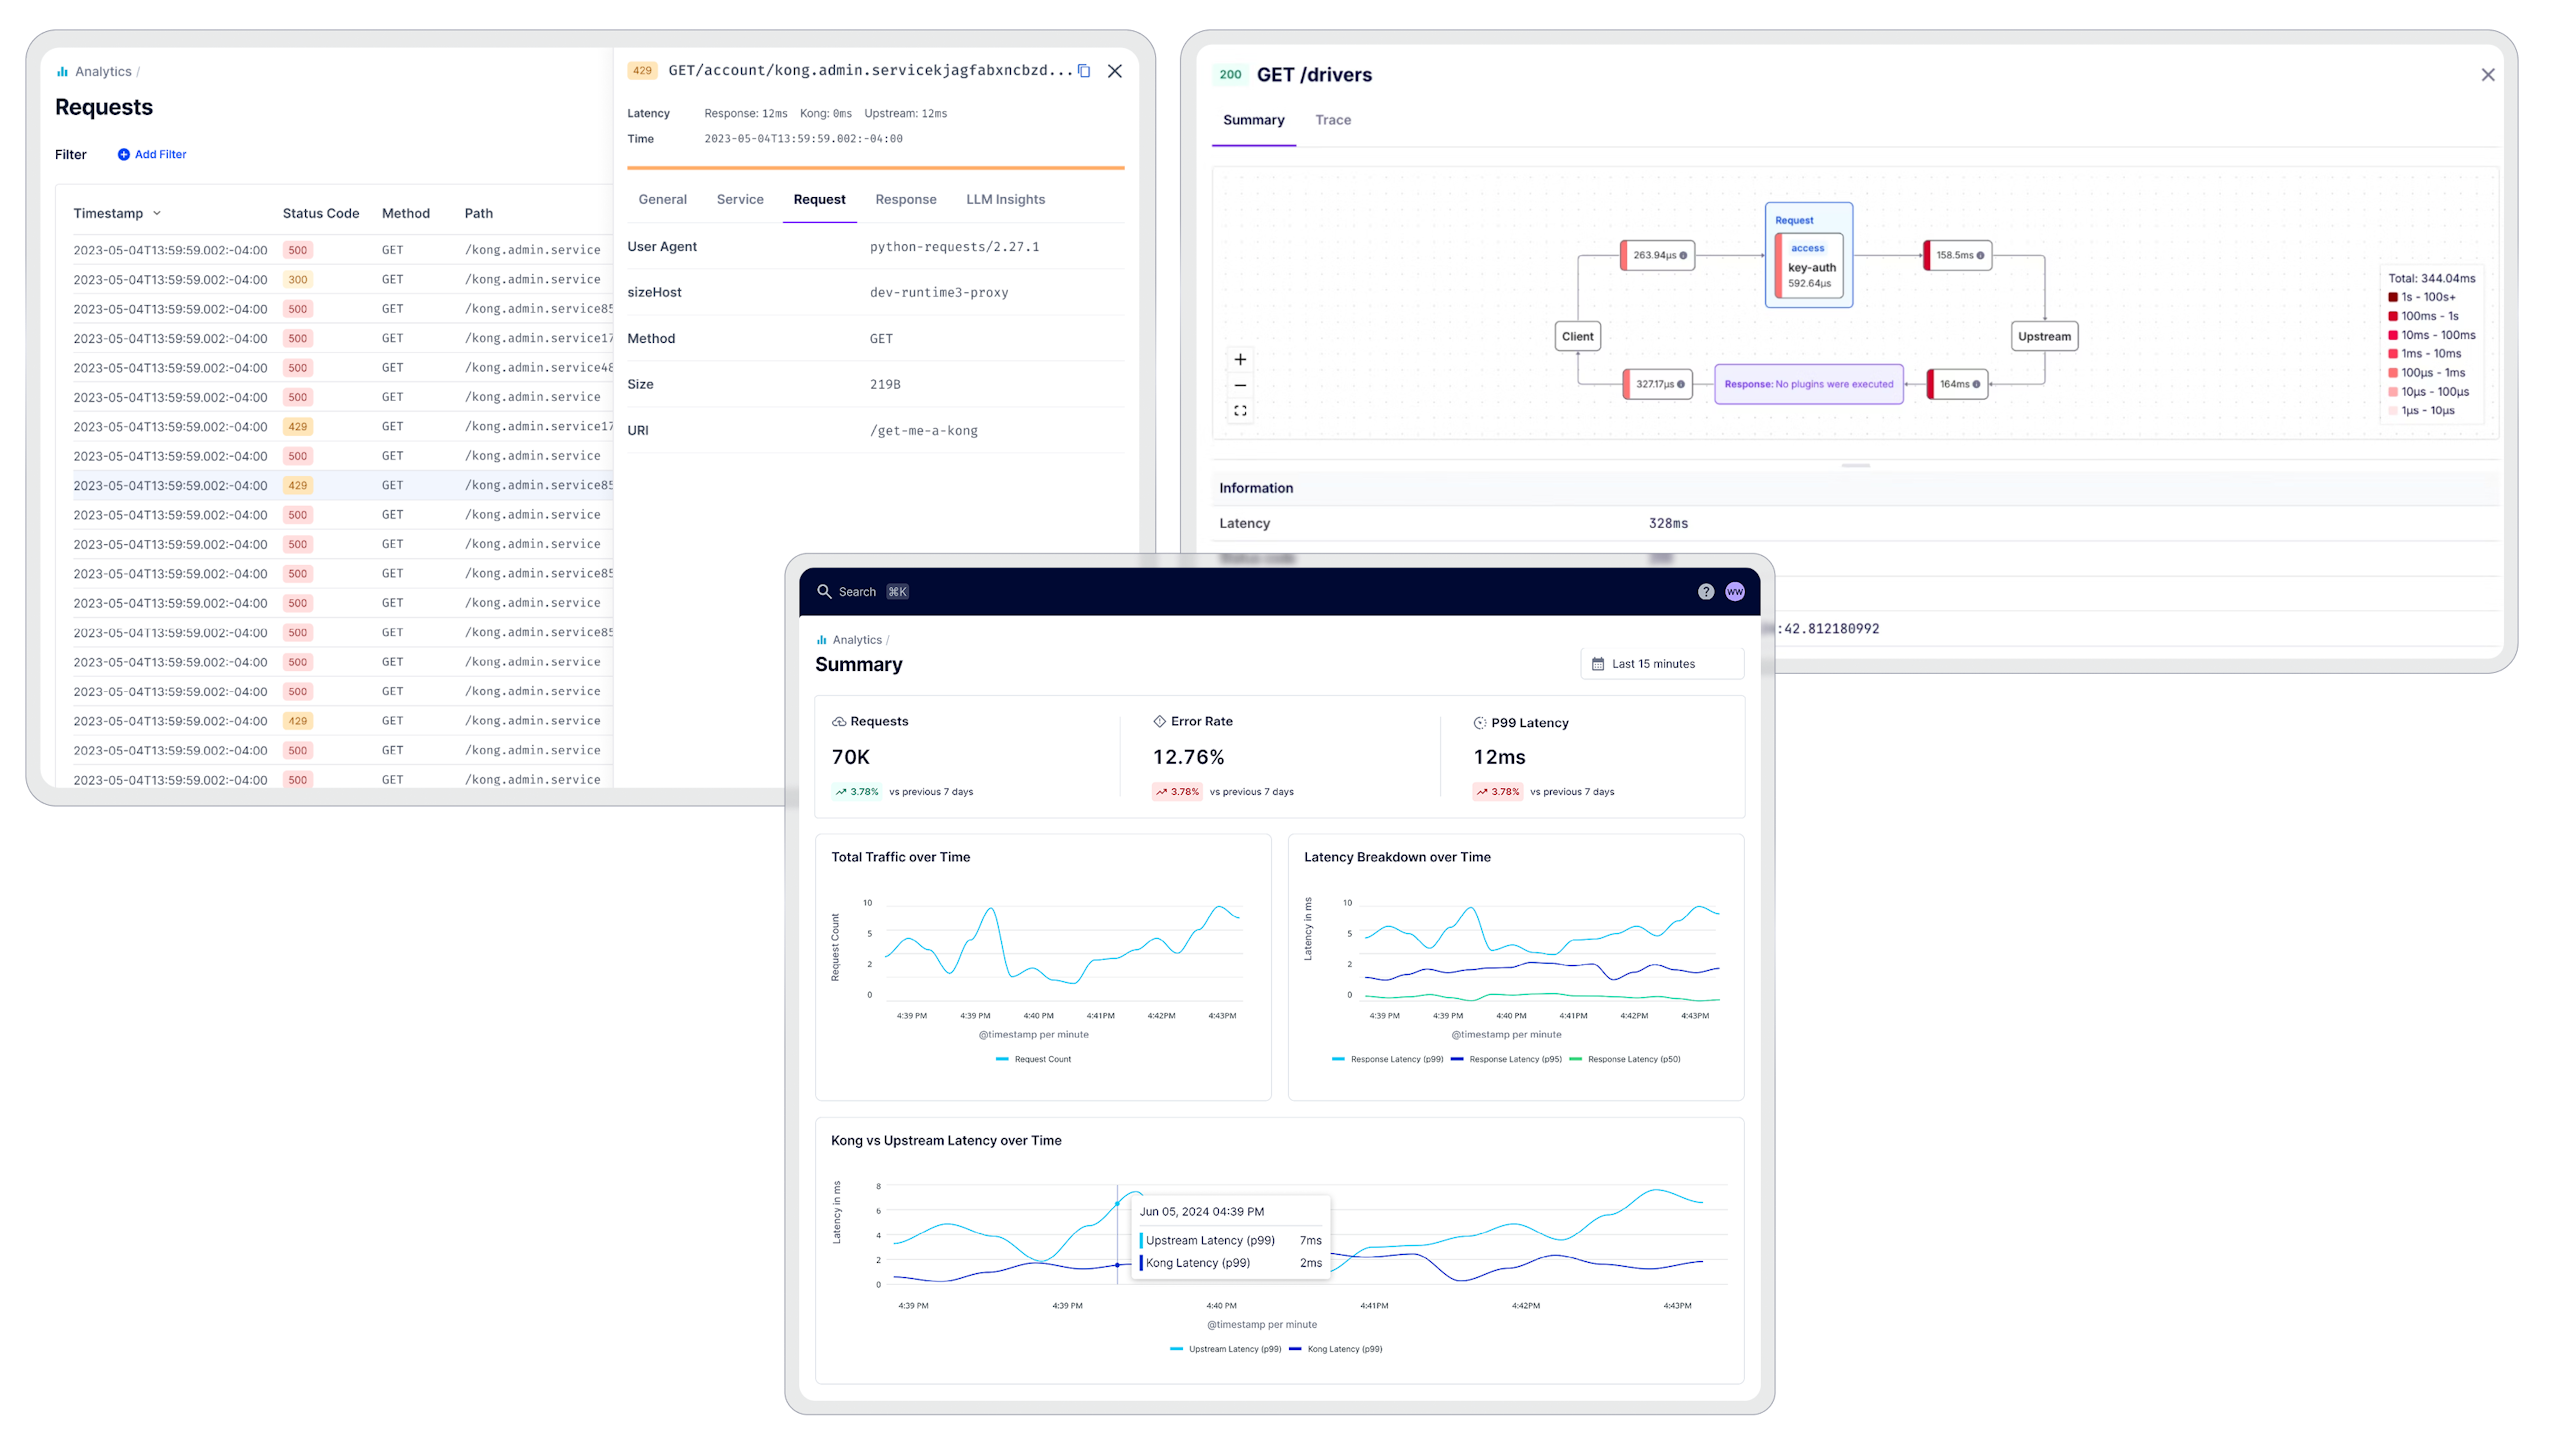
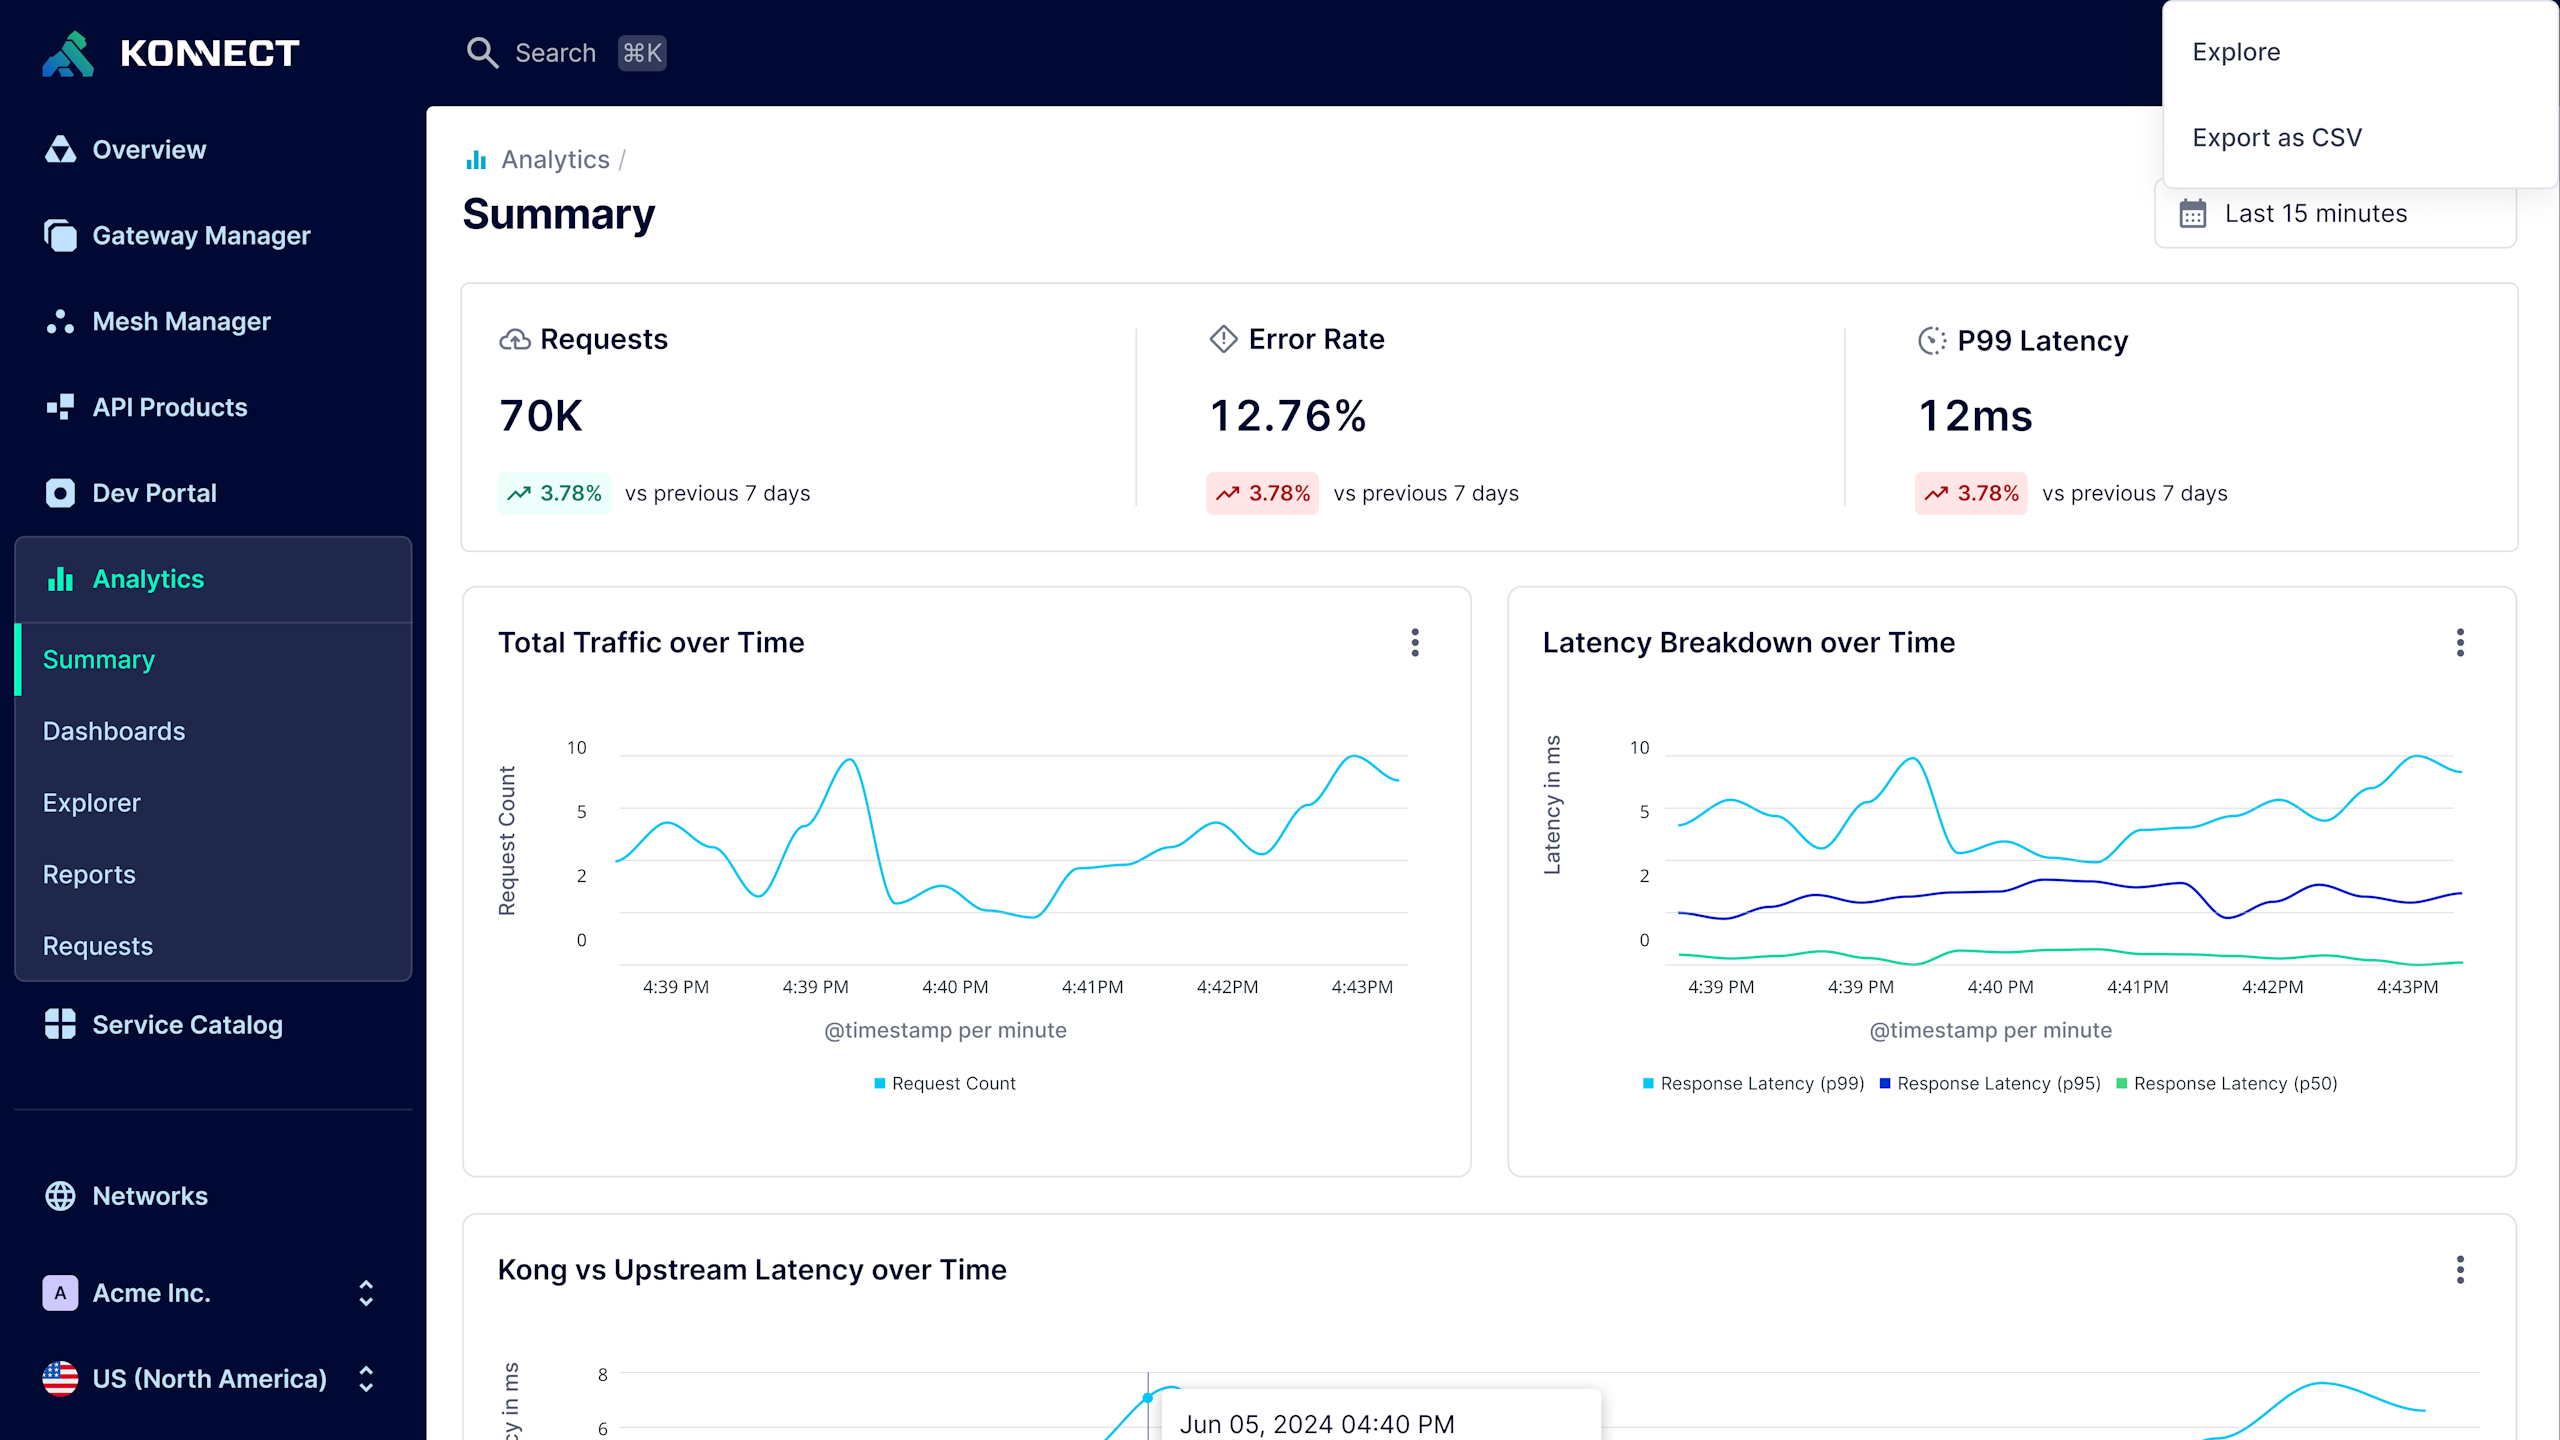
## Real-time API monitoring to power excellent customer experiences
- - Drive unified visibility into API performance and health across your organization.
- - Detect anomalies in request volume, error rates, average latency, and potential security risks in real-time.
- - Drill into key metrics with interactive charts and time-based filters to accelerate issue resolution.
- - Uncover usage trends over time with custom reports to inform capacity planning and performance tuning.
_03/ API Product Metrics_
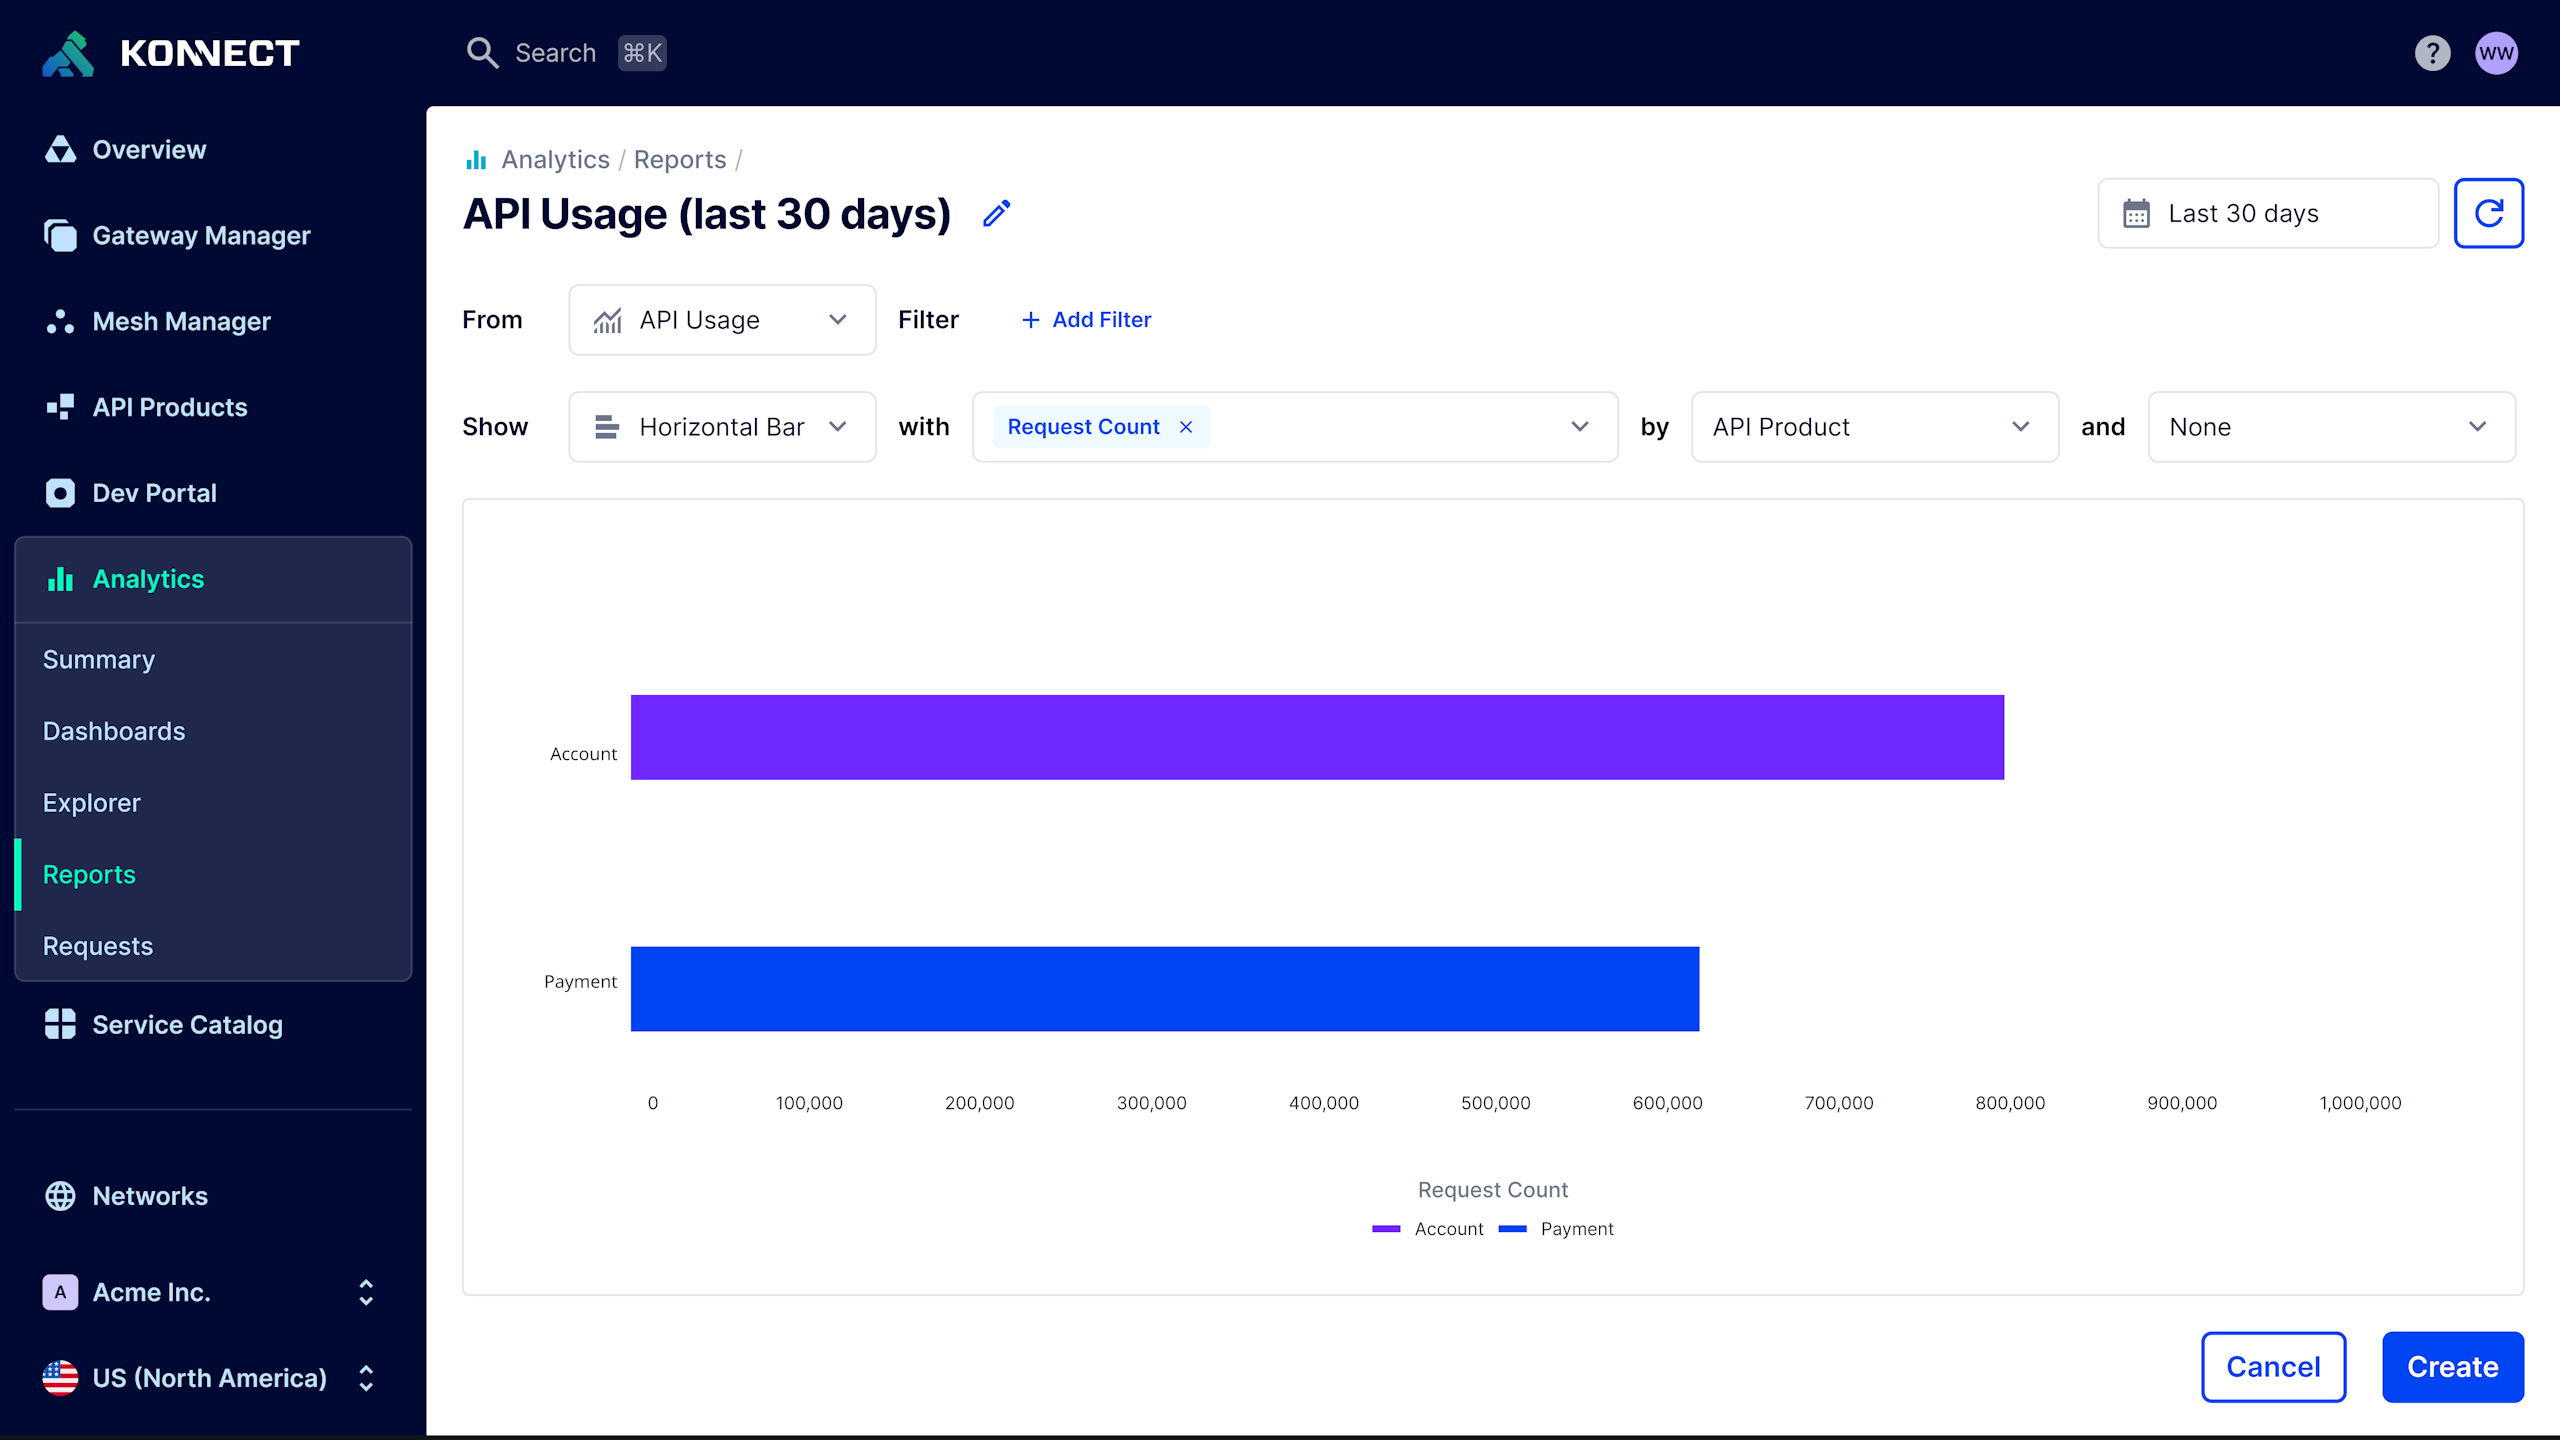
## Continuously refine your API program with usage insights
- - Analyze and/or compare the request count and throughput of specific APIs, applications, consumers, control planes, and more.
- - Identify high-leverage APIs by monitoring API usage metrics via Dev Portal(s).
_04/ Active Tracing_
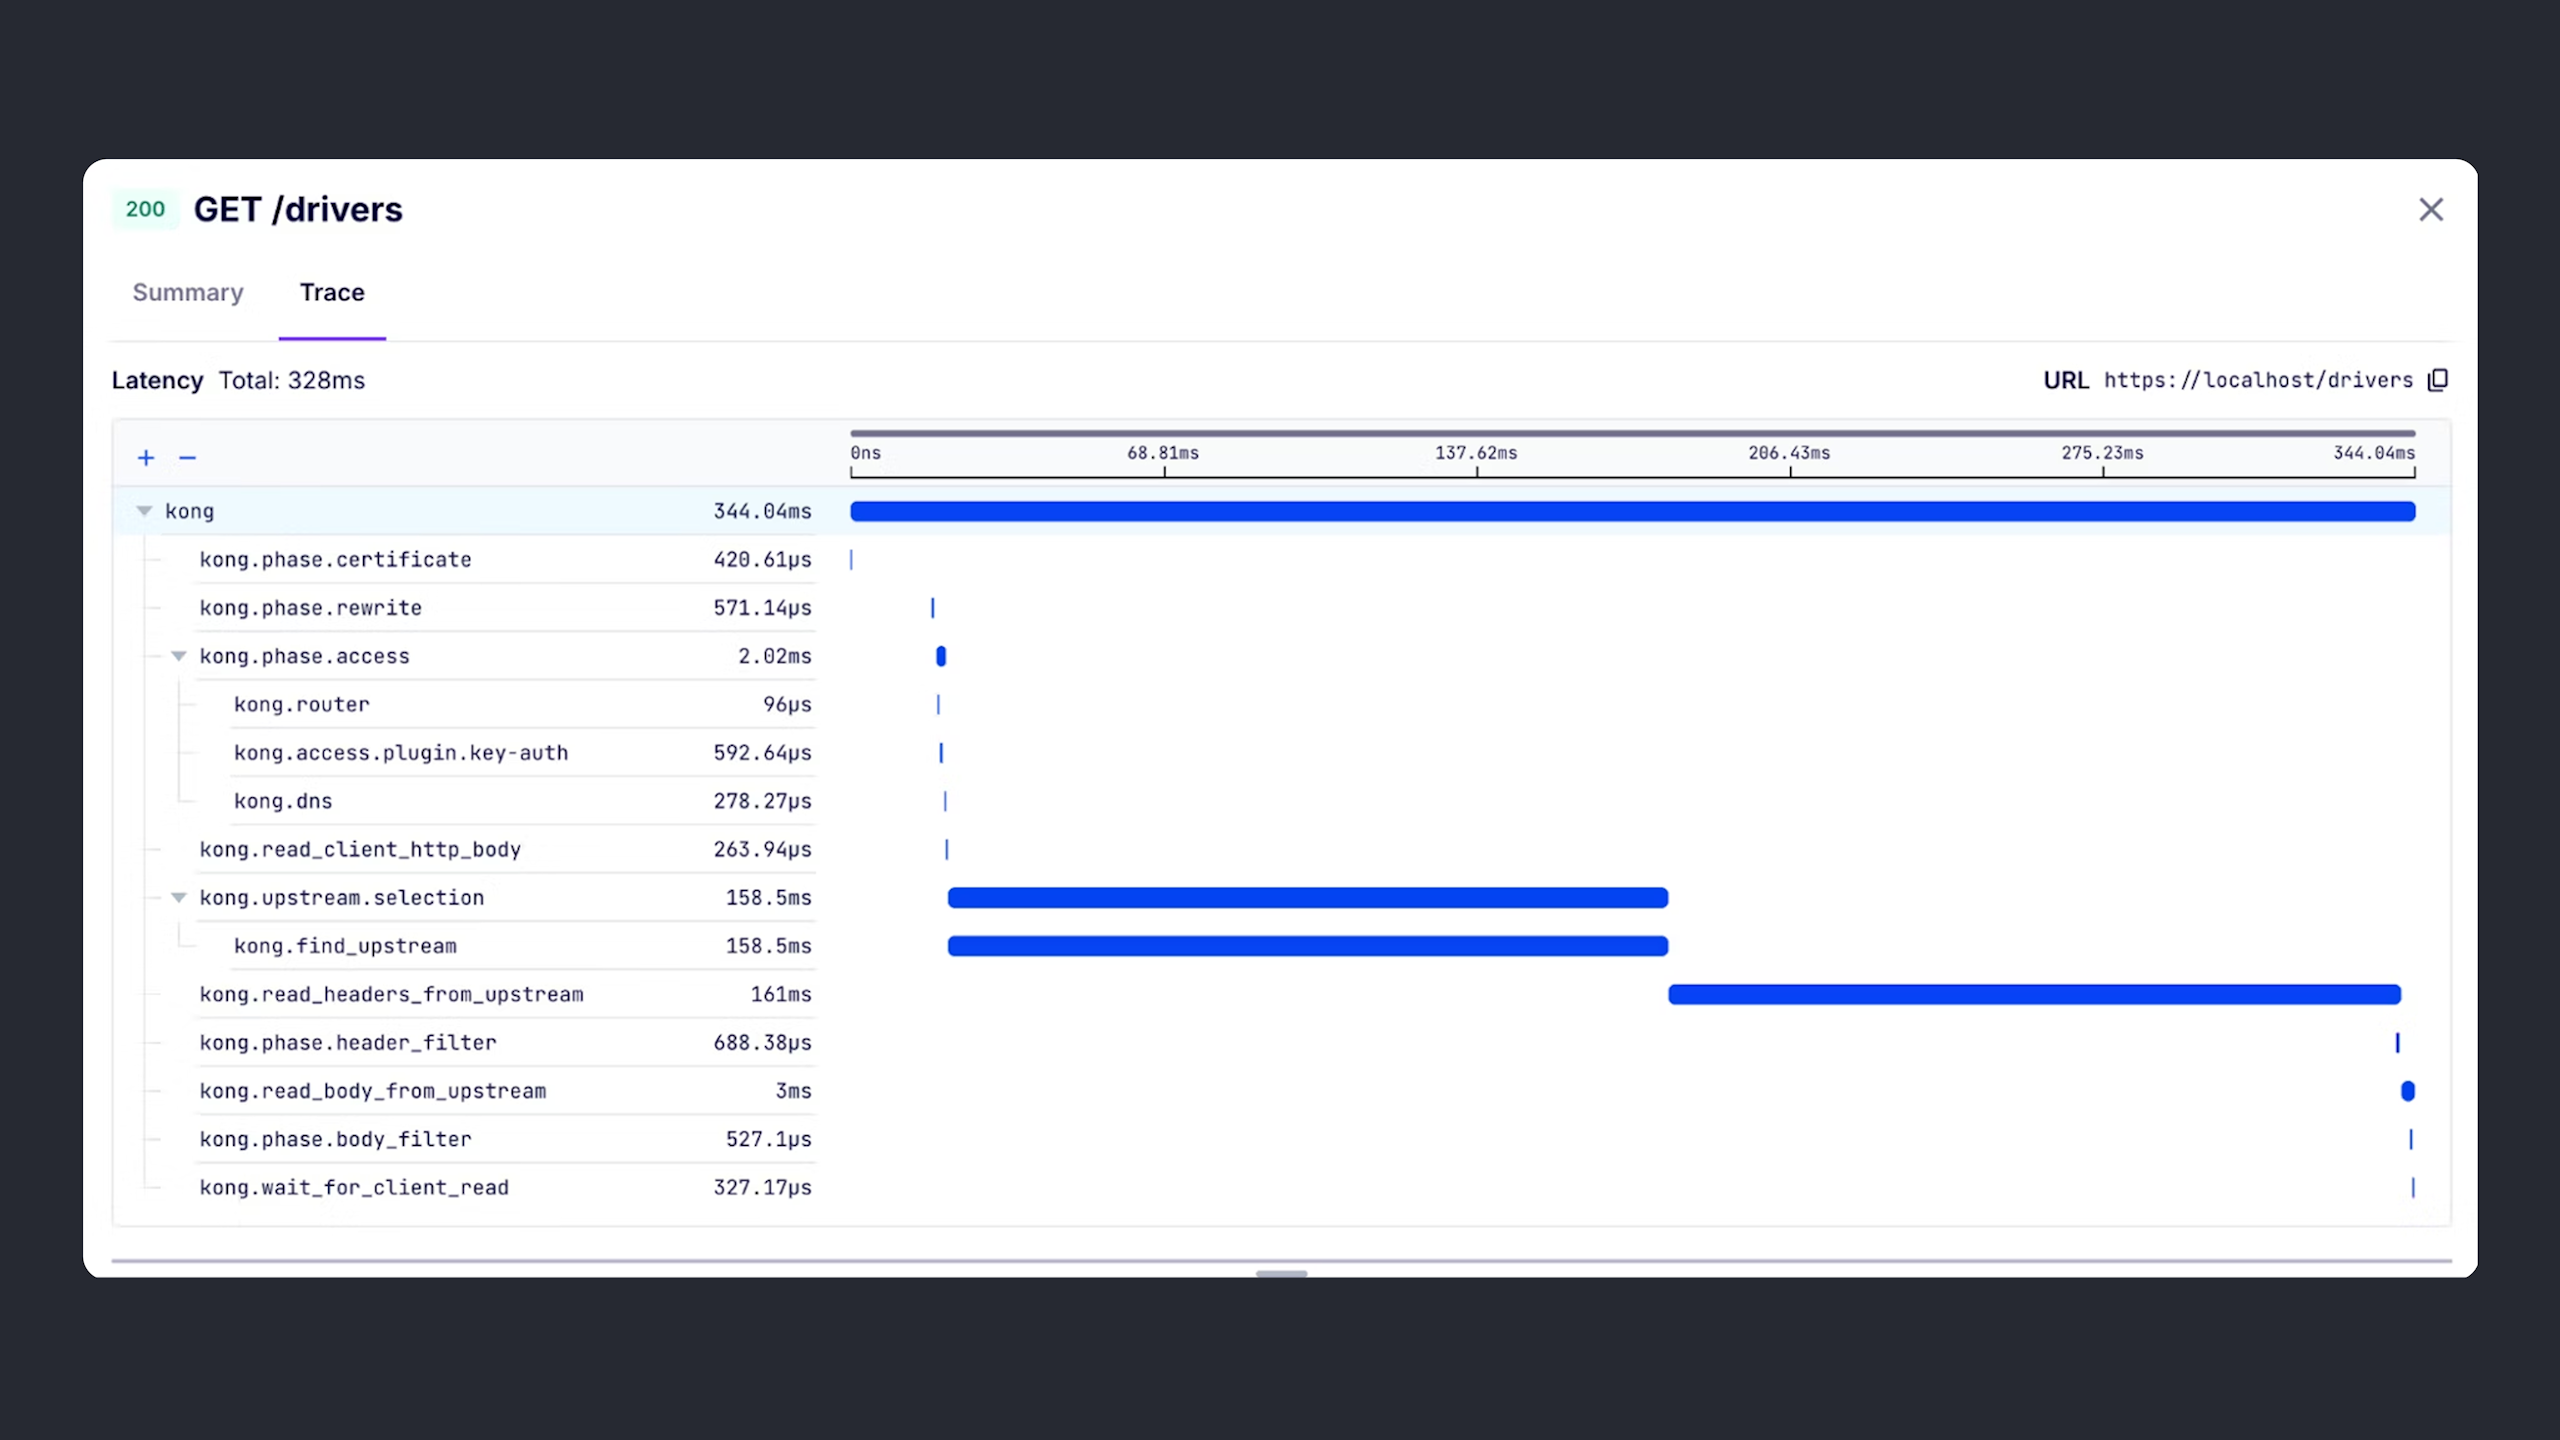
## Pull highly detailed telemetry when you need it with Active Tracing
- - Start targeted tracing sessions on gateway nodes and view them in Konnect’s built-in trace viewers.
- - Pinpoint the root cause of an issue with visibility into the entire request-response API flow, plugin execution, and Kong’s internal processing.
- - Generate component-level telemetry data to gain a deeper understanding of your services’ performance, dependencies, and potential bottlenecks.
- - Refine your configuration to prevent issues from repeating.
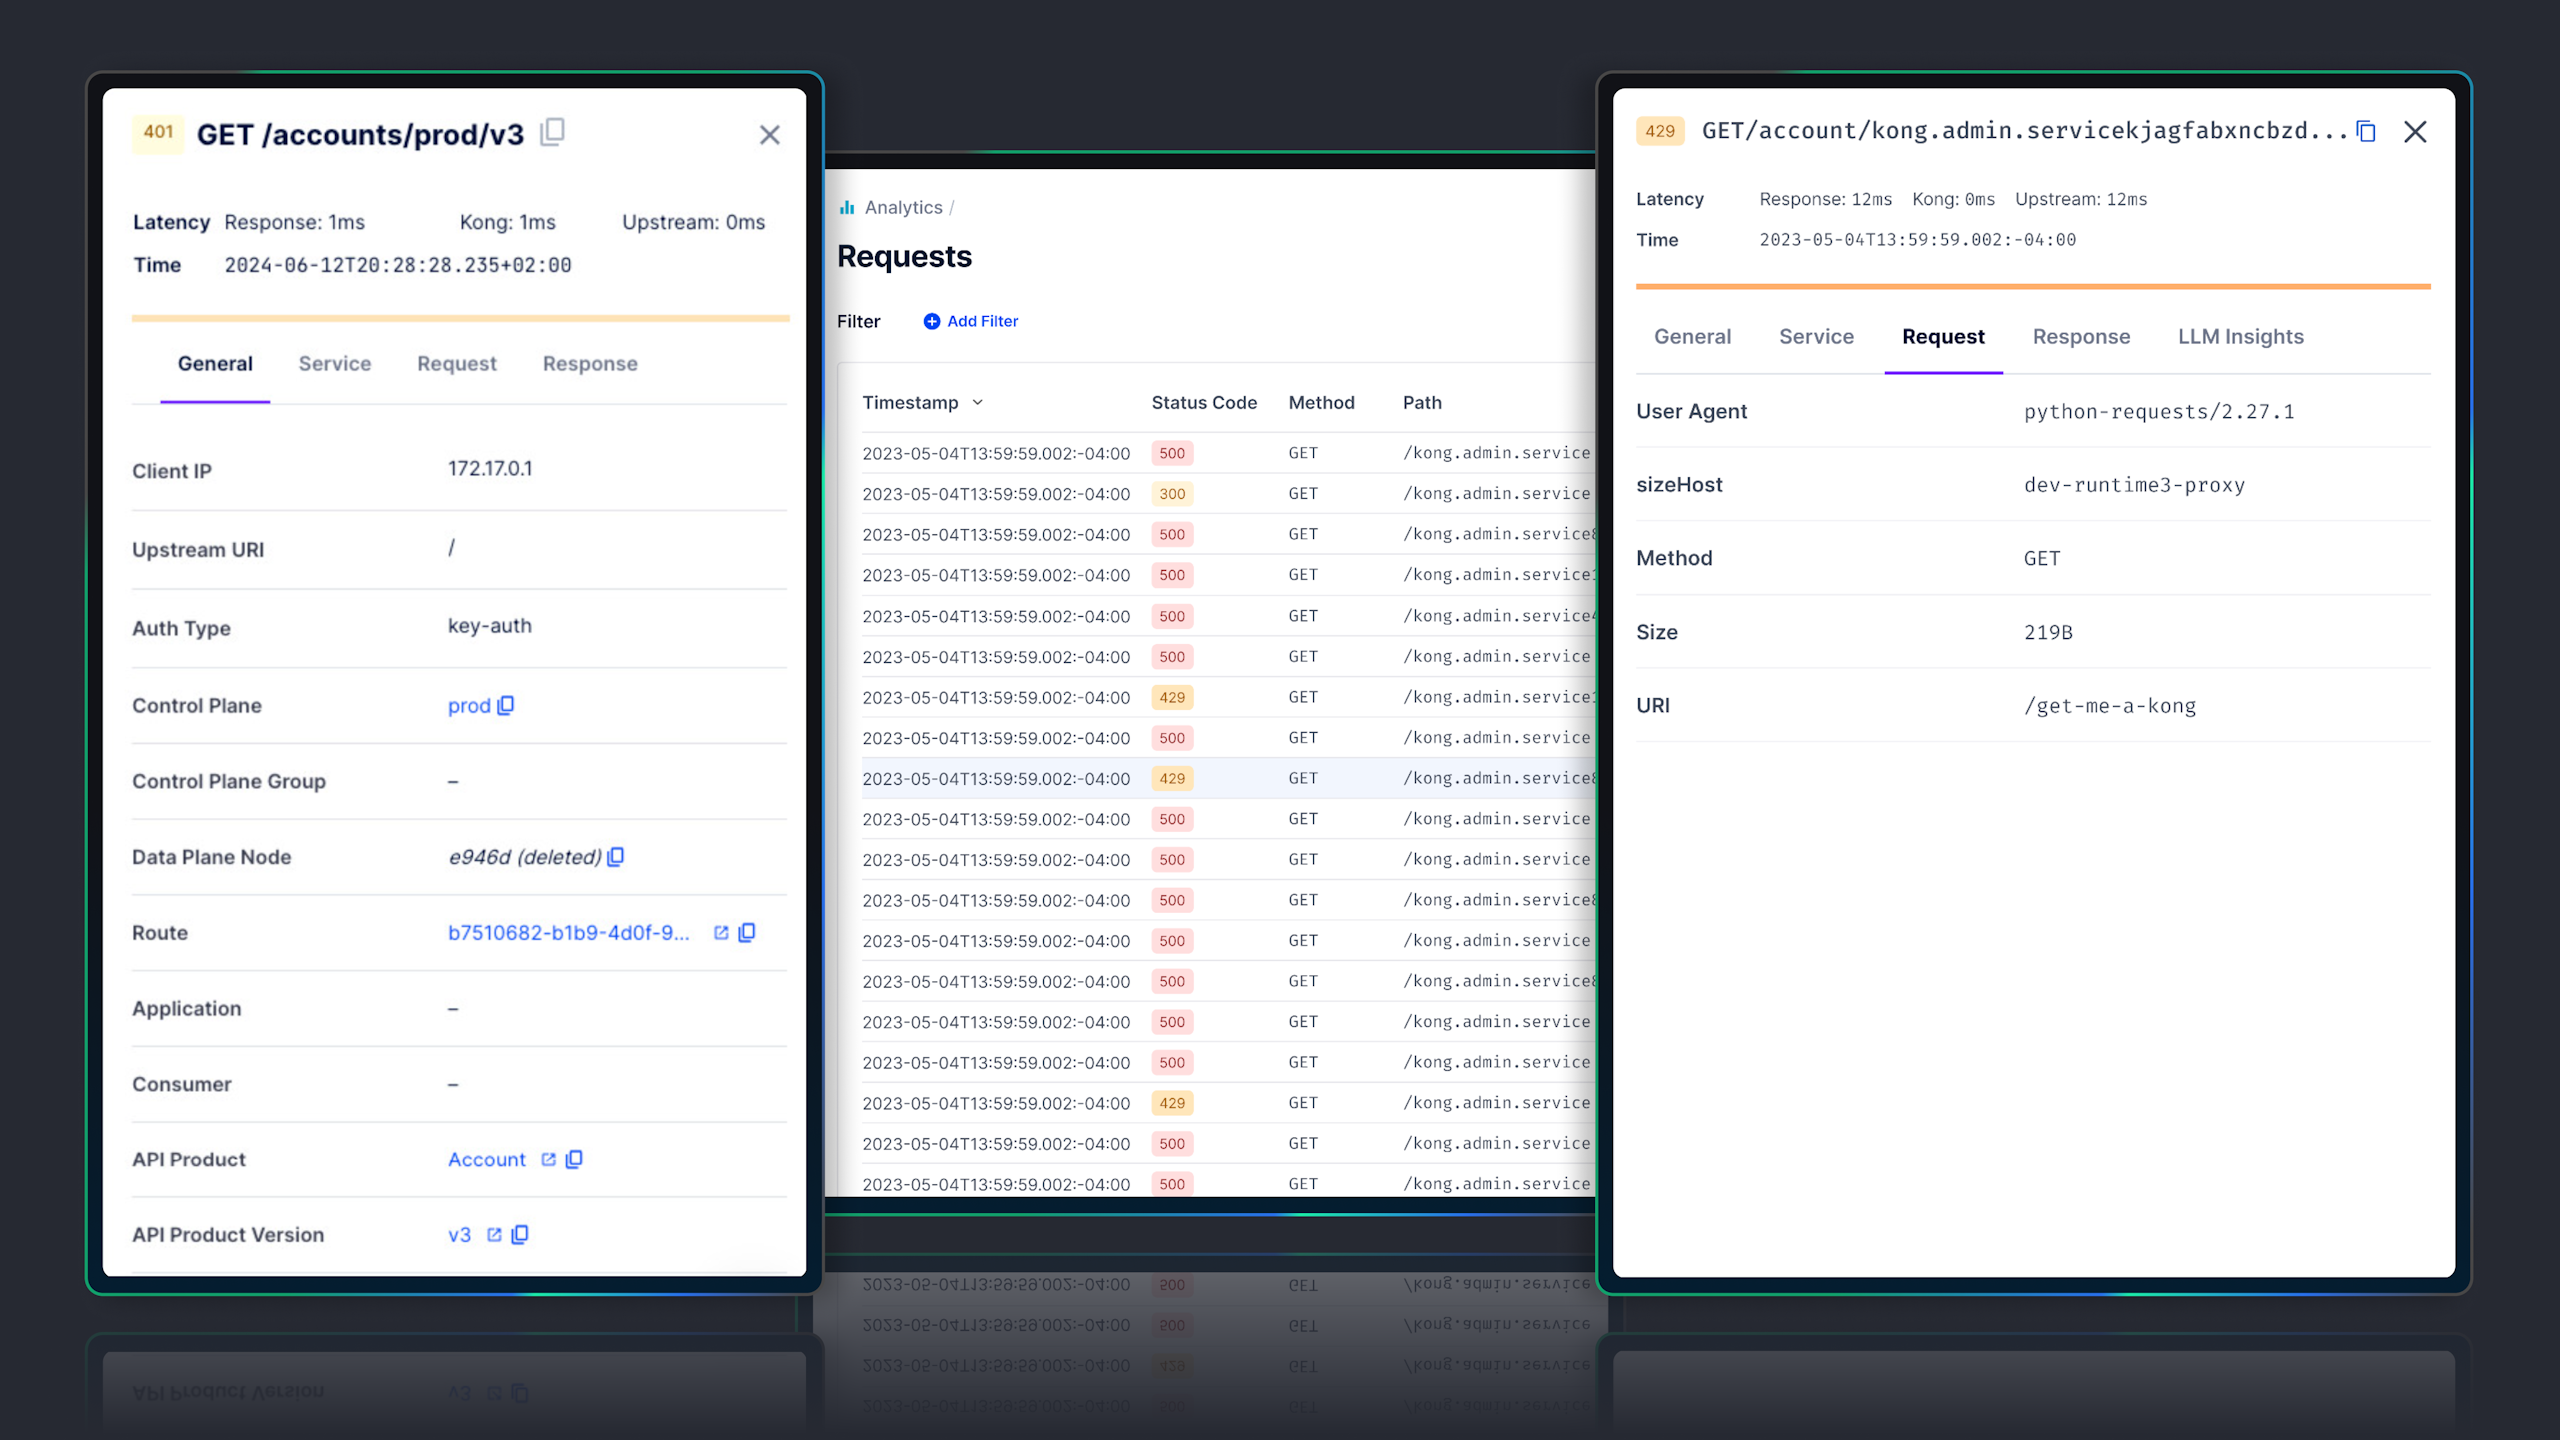
_05/ Logs_
## Debug faster with API and Gateway logs
- - Filter and inspect API requests with an intuitive user interface in Konnect Analytics.
- - Grasp popular endpoints, peak usage times, and user behavior to enhance API reliability and ensure the proper security controls are in place.
- - Simplify initial investigations into errors with Kong-contextualized insights, allowing faster navigation to gateway configurations, consumers, and more.
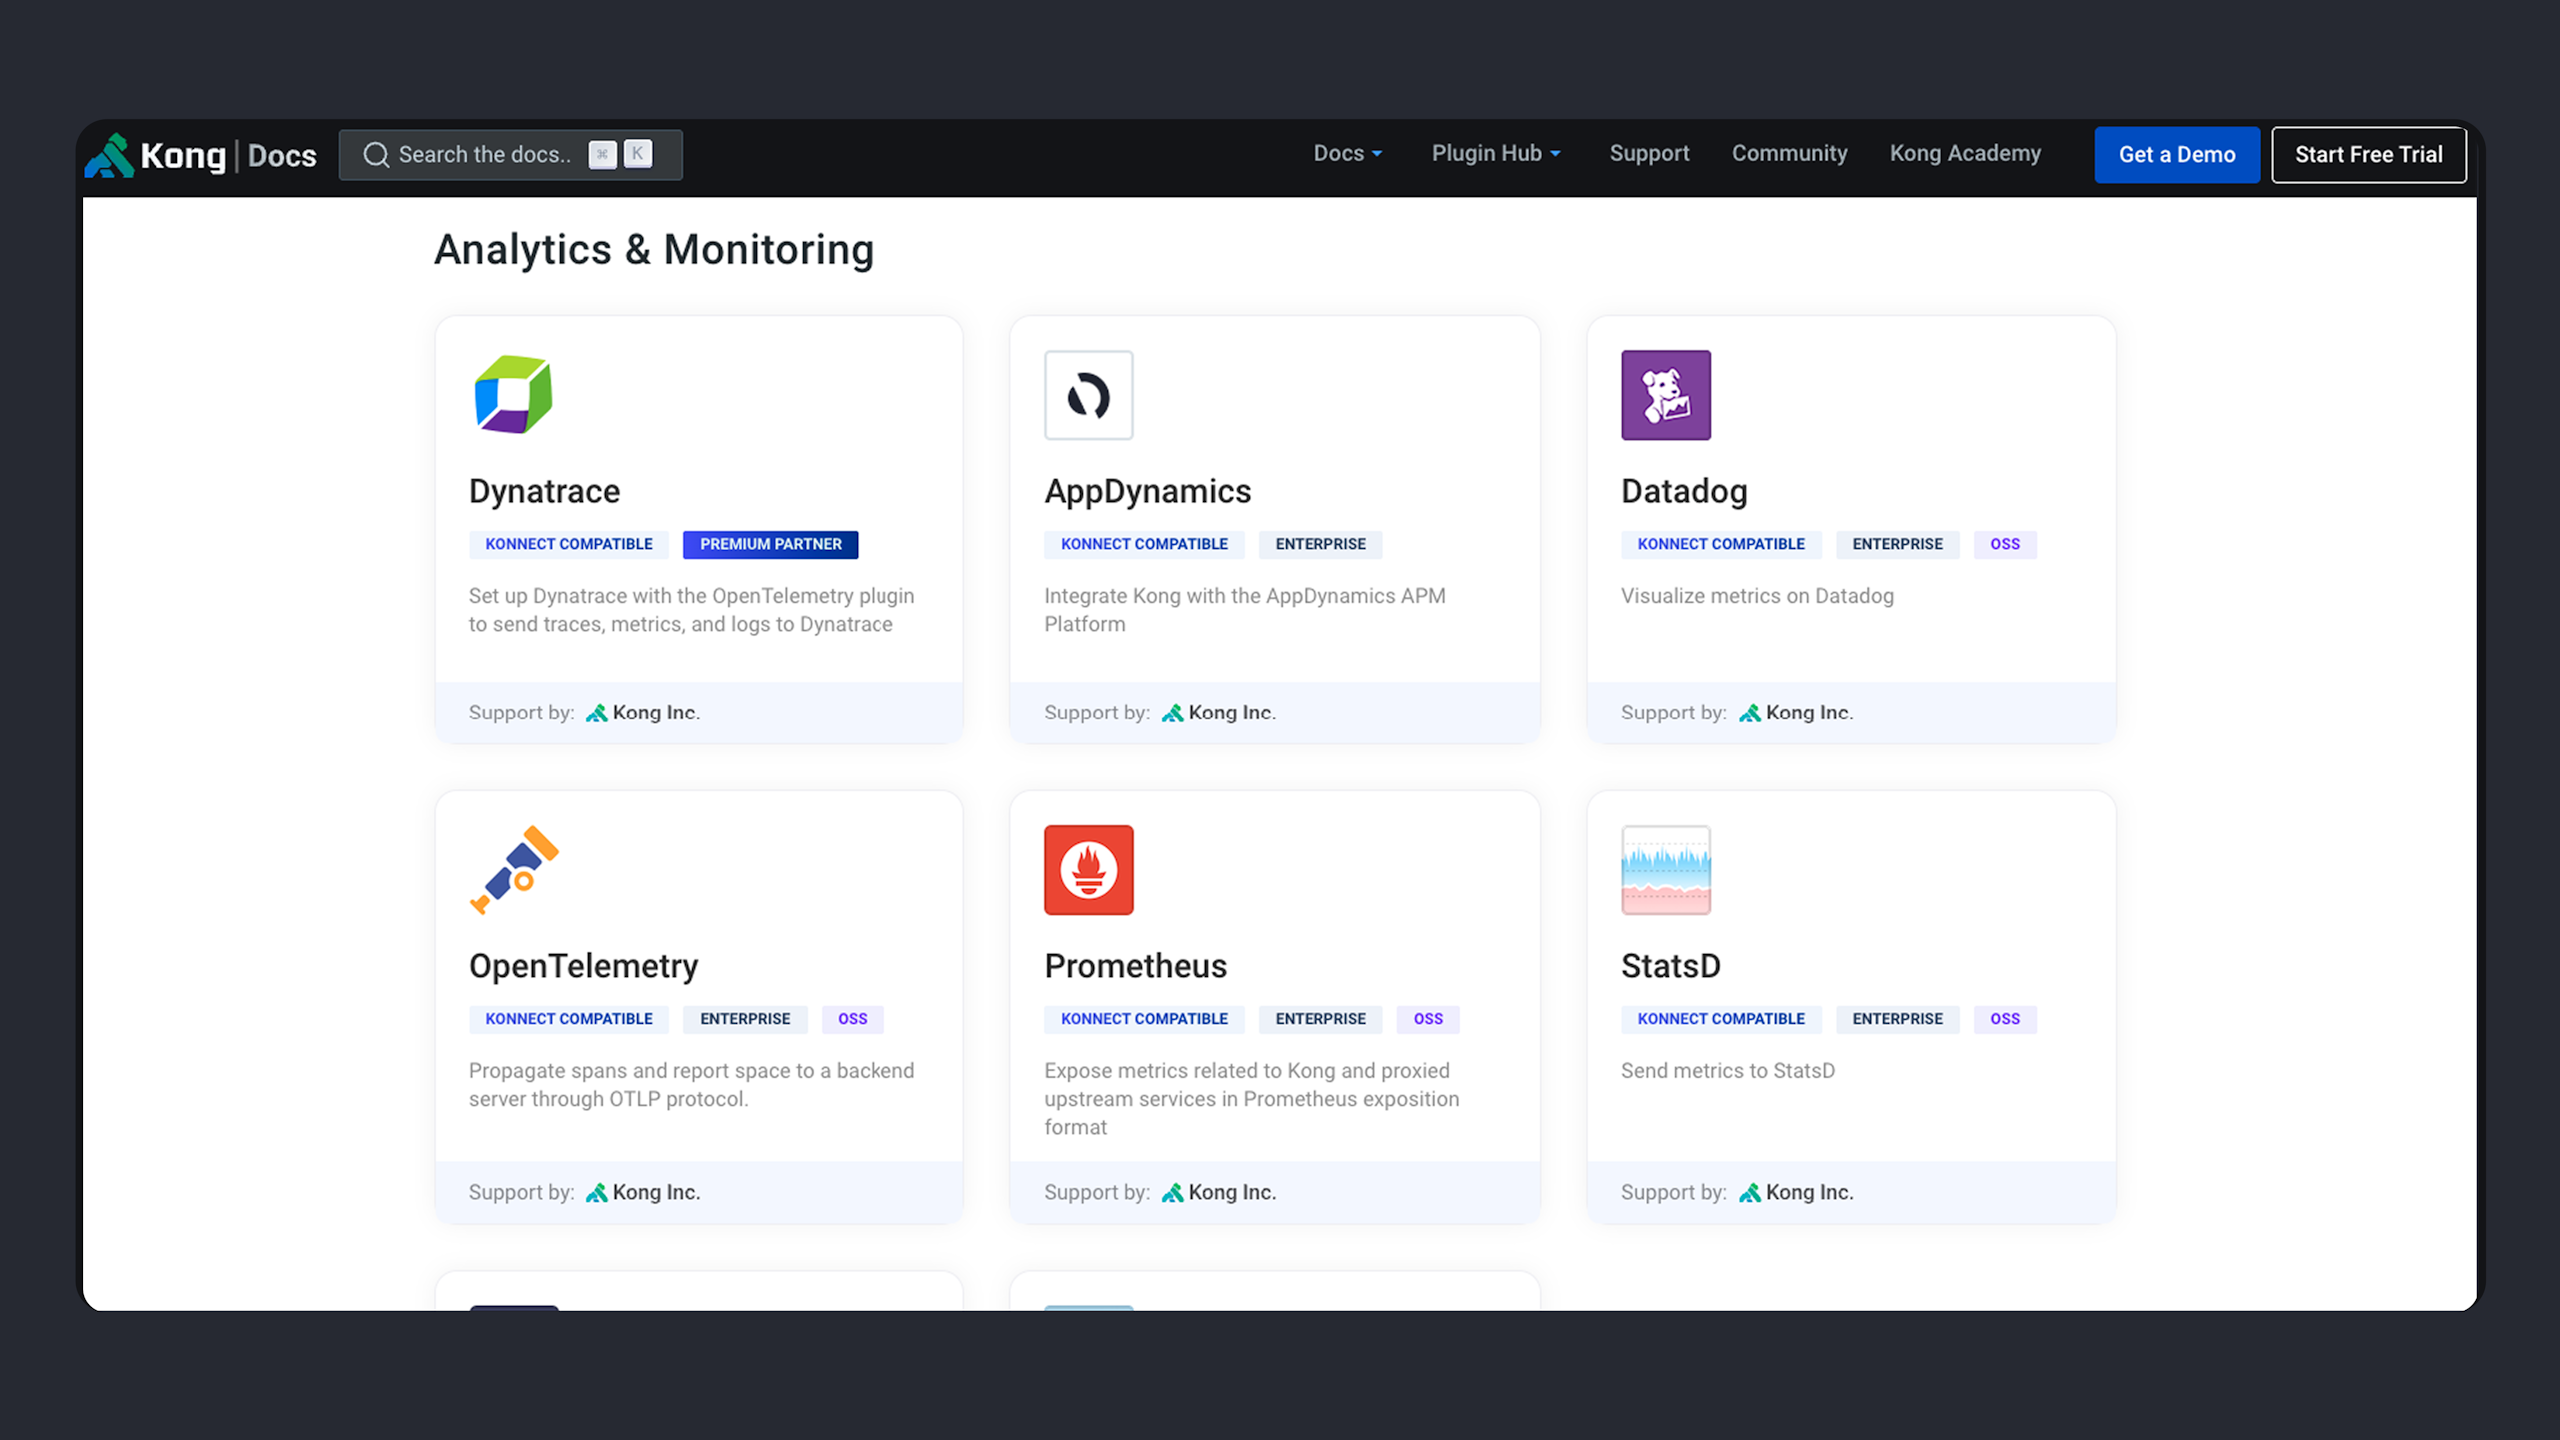
_06/ Ecosystem-friendly_
## Build the API observability strategy that suits your needs
- - View observability and analytics dashboards directly in Konnect and/or push metrics to your favorite enterprise observability solutions, such as Dynatrace, Datadog, Prometheus, and more.
- - Send request and response logs to various third-party systems, such as Kafka, Syslog, and more.
## Related Resources
_Blog_
[__New Enhancements to Konnect to Fuel API-Driven Innovation
__](/blog/product-releases/new-enhancements-to-konnect)__New Enhancements to Konnect to Fuel API-Driven Innovation
___Blog_
[__