If you build APIs, you’ve probably been in two kinds of conversations. One is the war room, where the team is chasing a latency spike, an outage, or a sudden drop in traffic. The other is the boardroom, where you need to show how the platform is performing, which APIs are growing, and whether your investments are paying off.
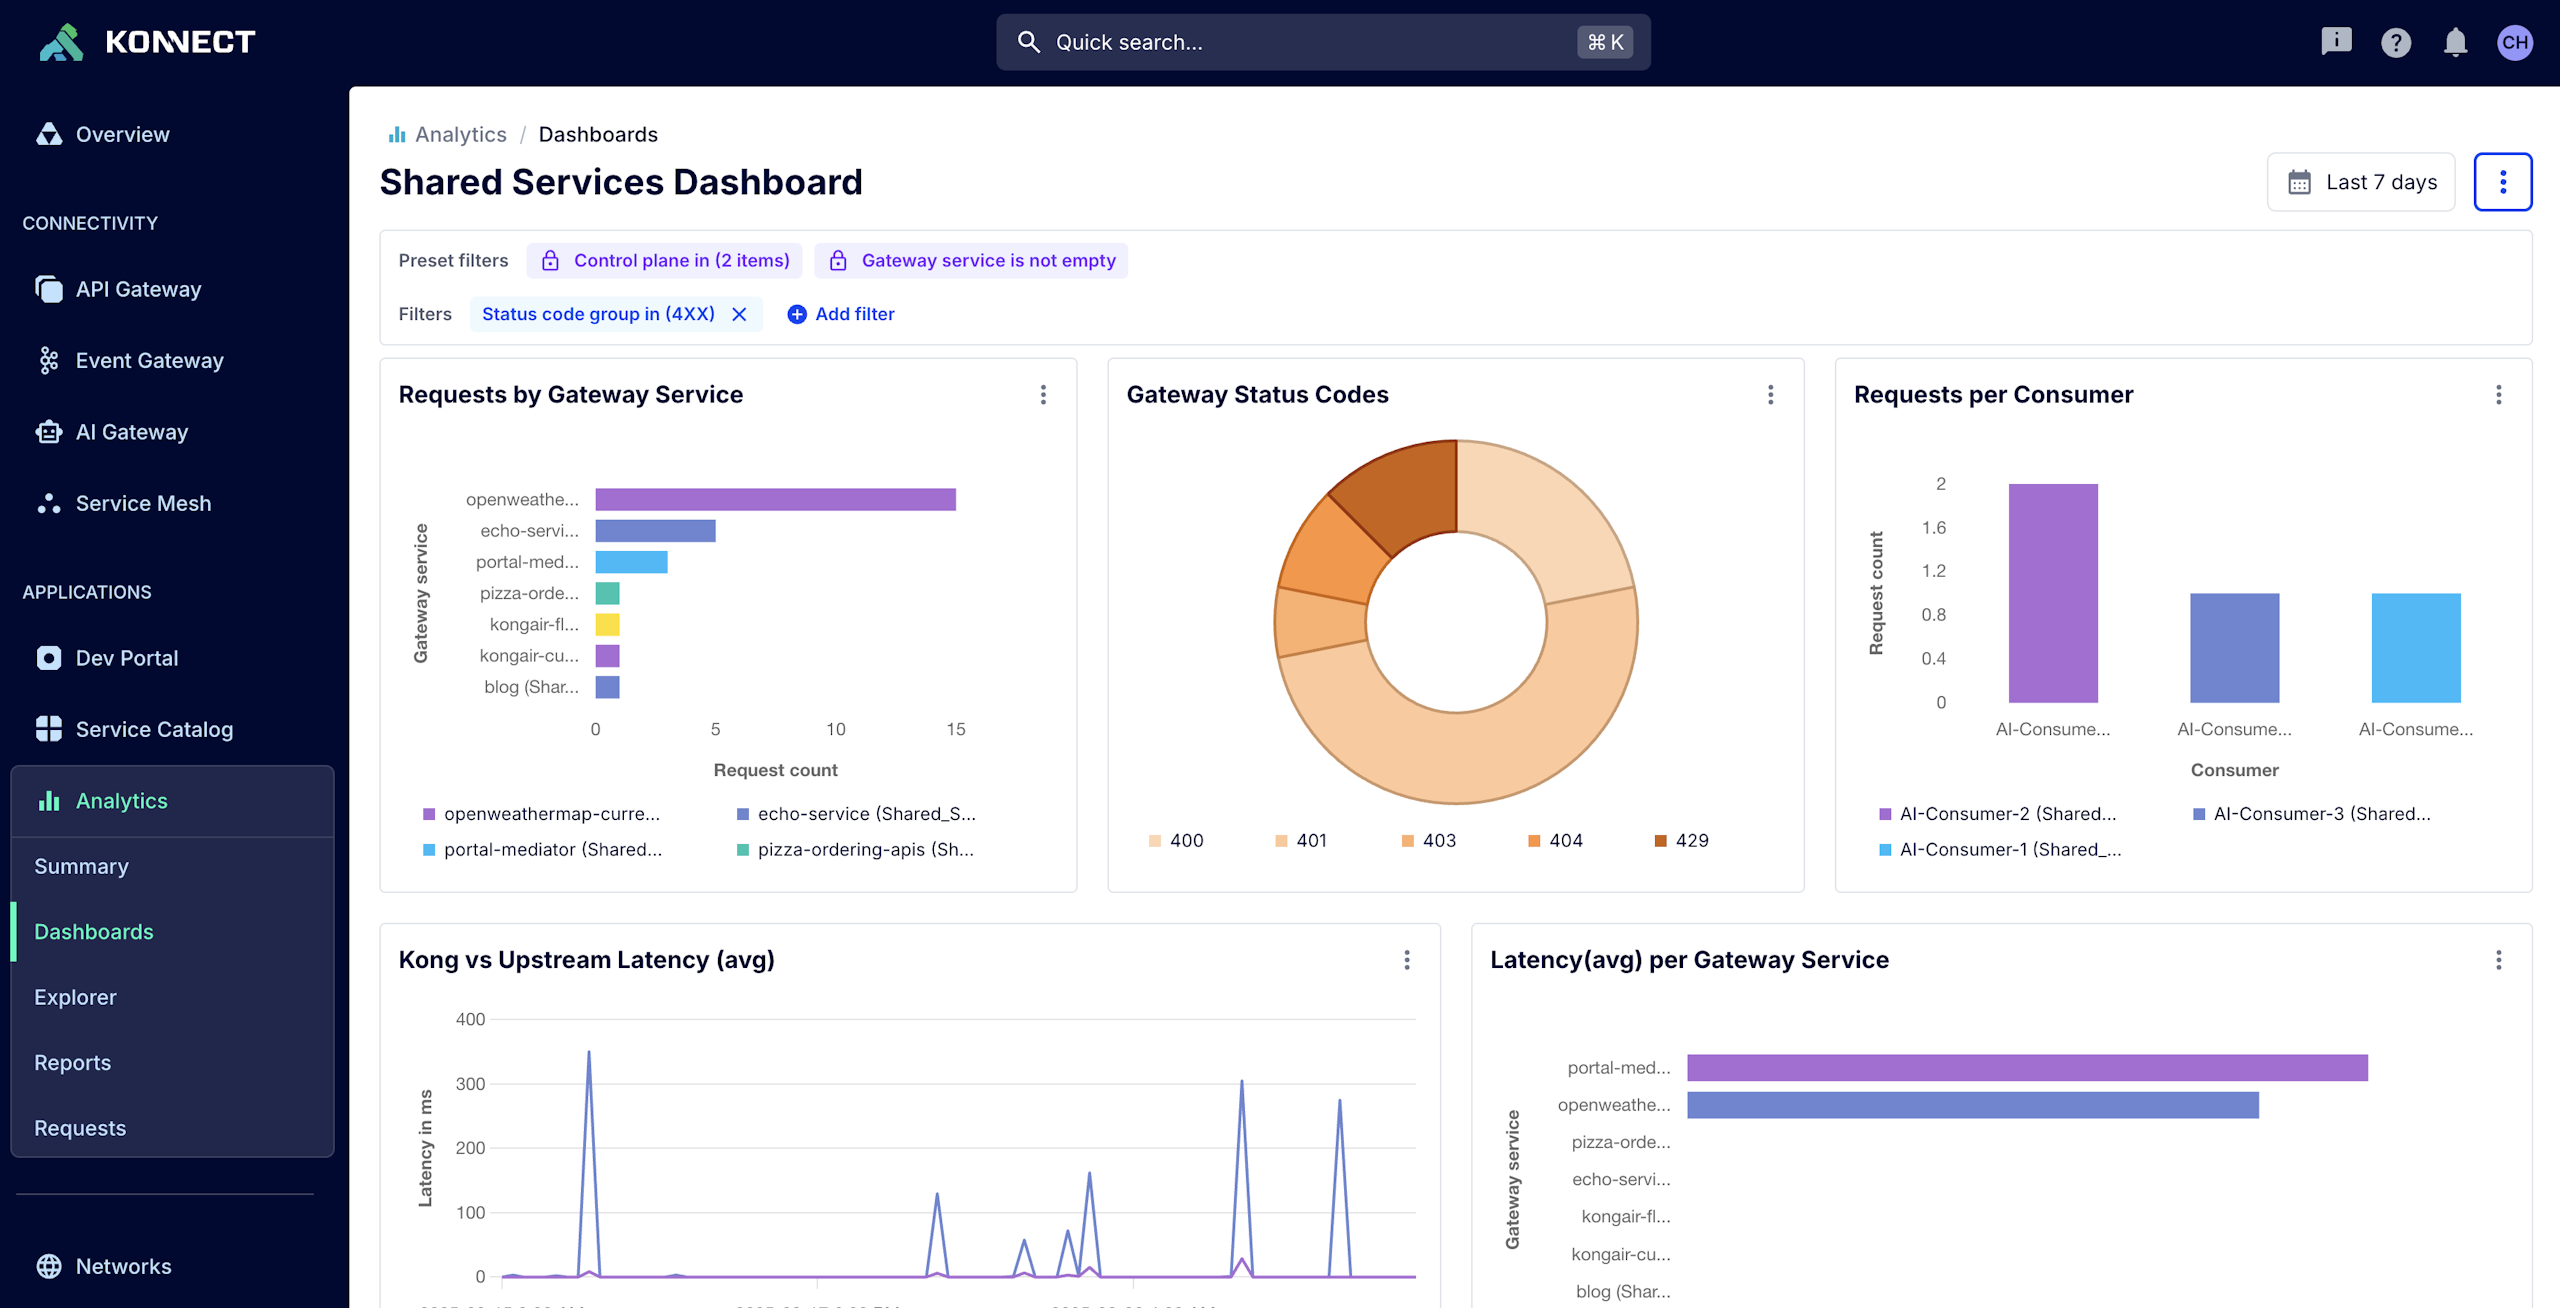
Dashboards are the tool people turn to in both cases. They take a constant stream of signals, like requests, latencies, status codes, and errors and turn them into a view your team can act on. With the right dashboard, you can respond quickly when something breaks and tell a clear story when it matters.
The challenge is that not every team cares about the same signals. Ops care about latency and error trends, product managers want adoption and usage, and security teams look for traffic patterns.
Another challenge comes with federated teams: platform engineers are often expected to give each team a starting point by setting up the right dashboards for them. Managing this for many teams across large organizations quickly becomes unsustainable.
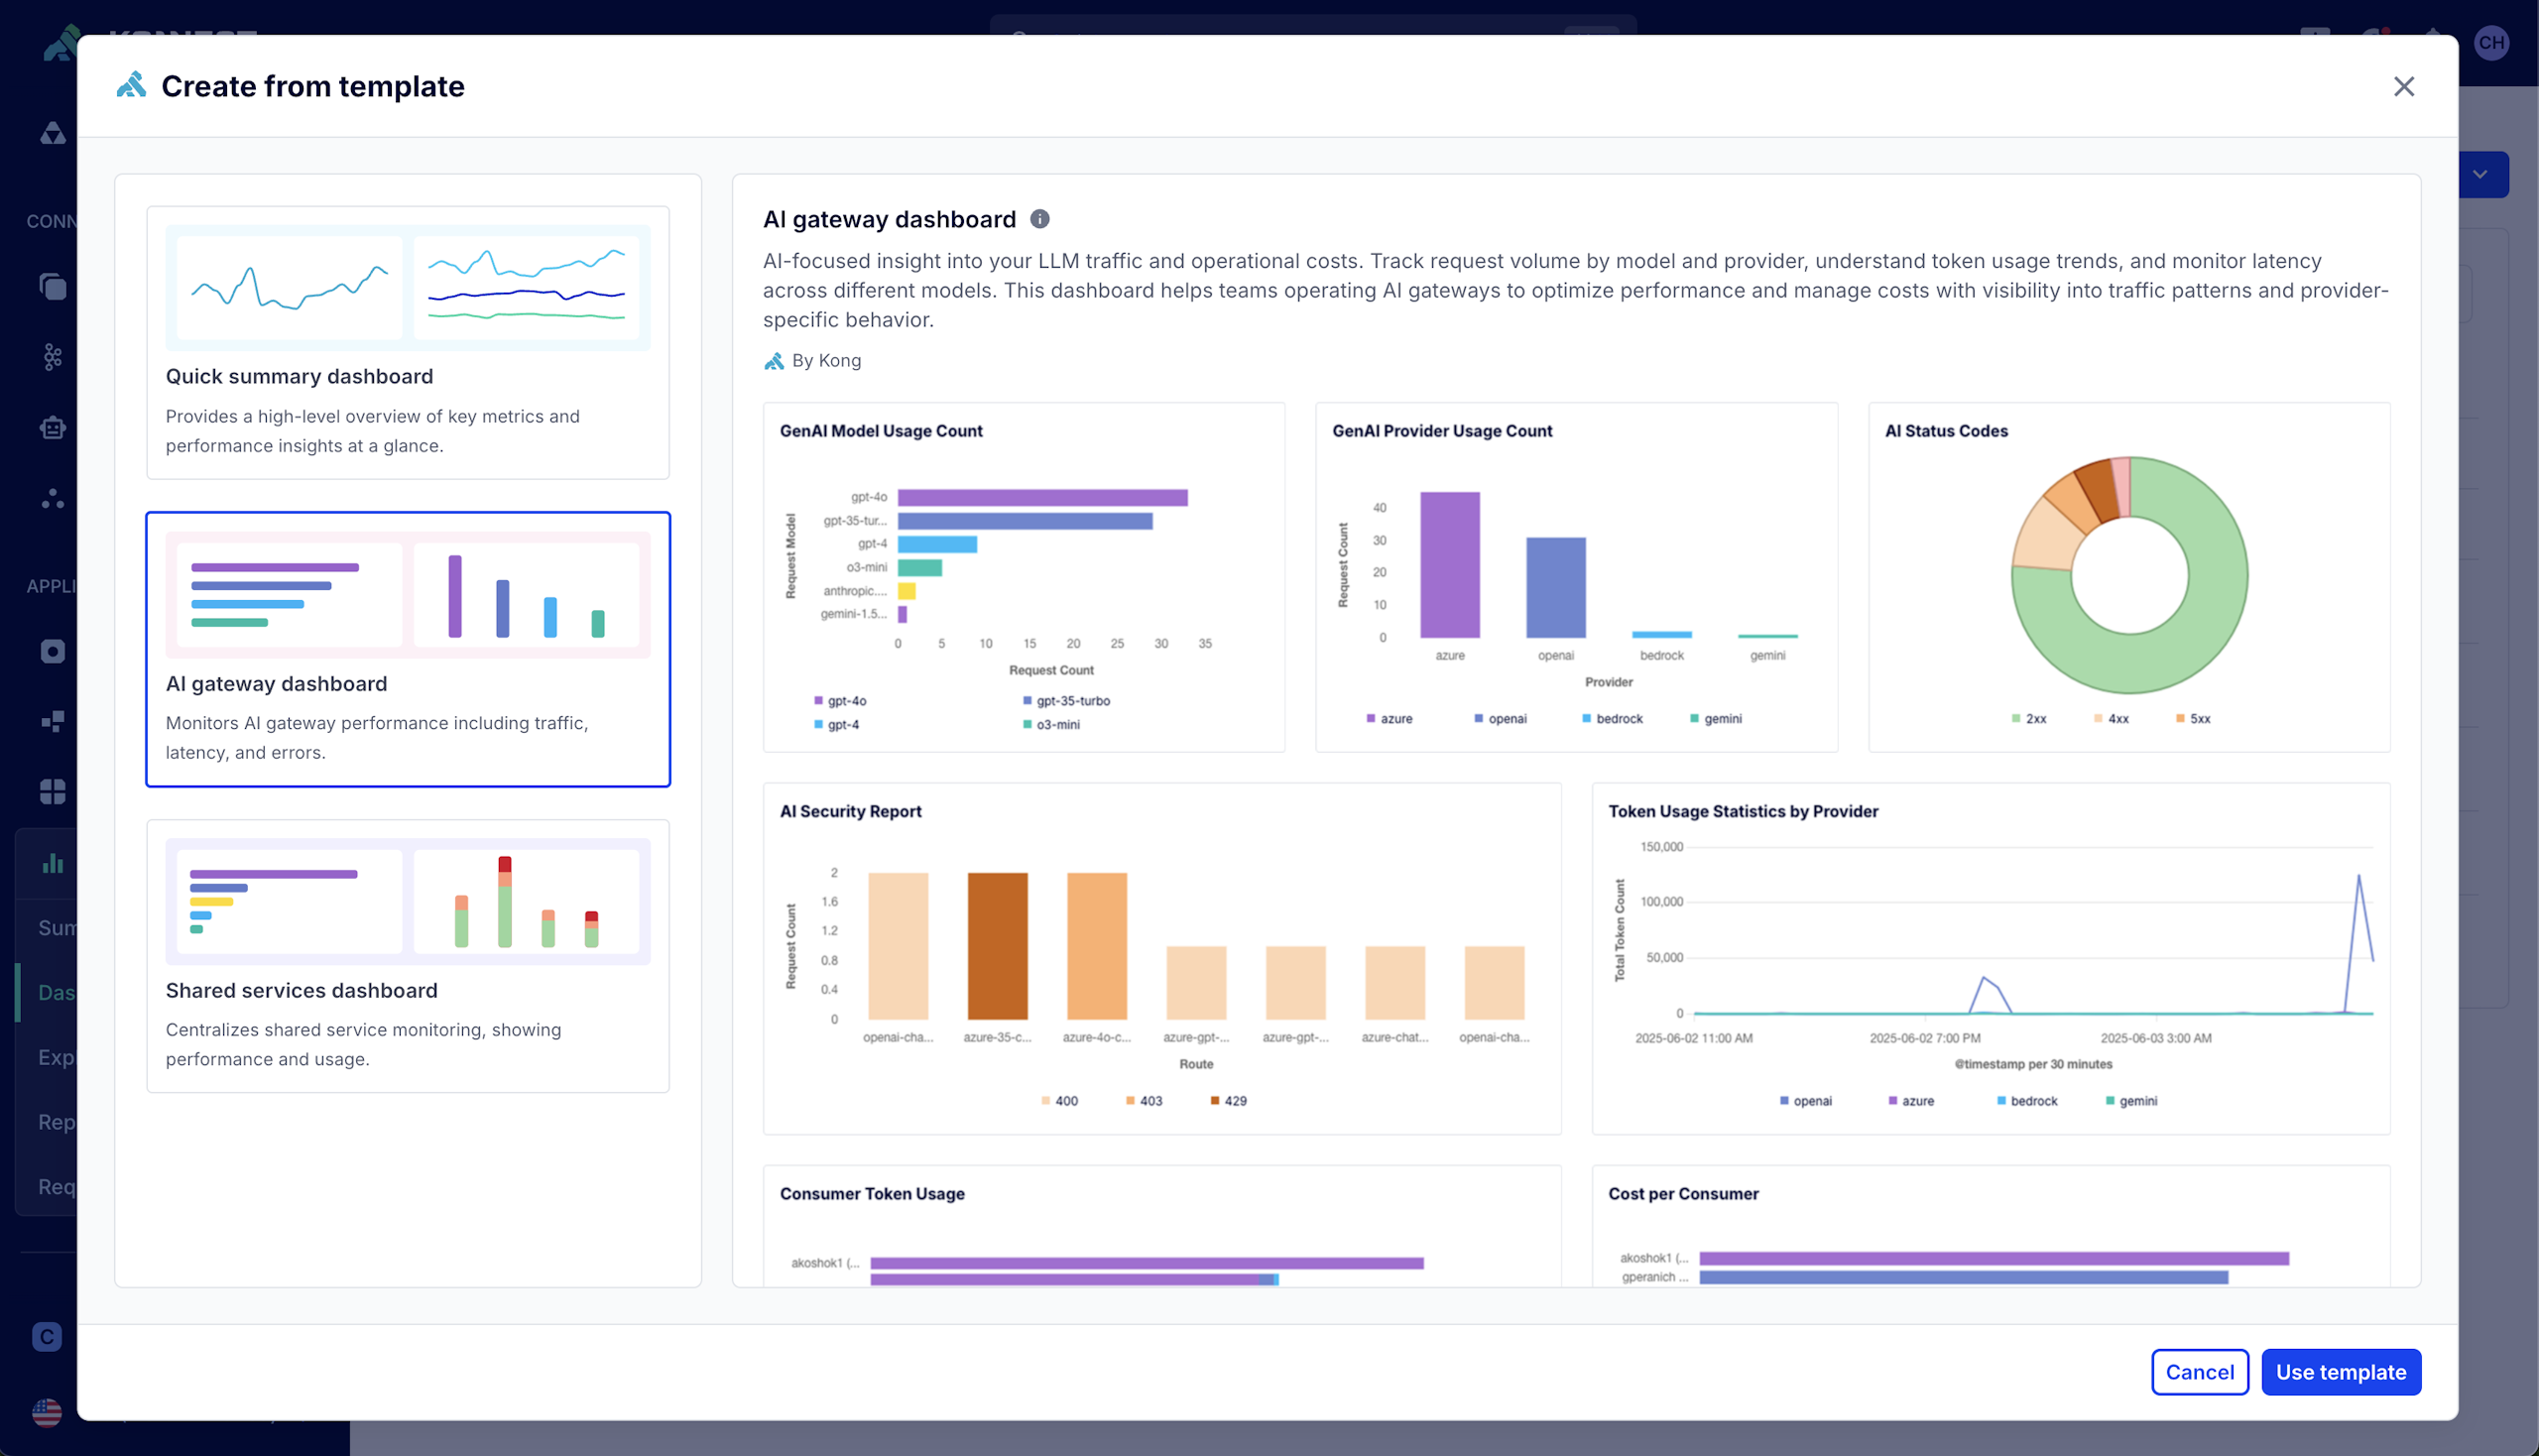
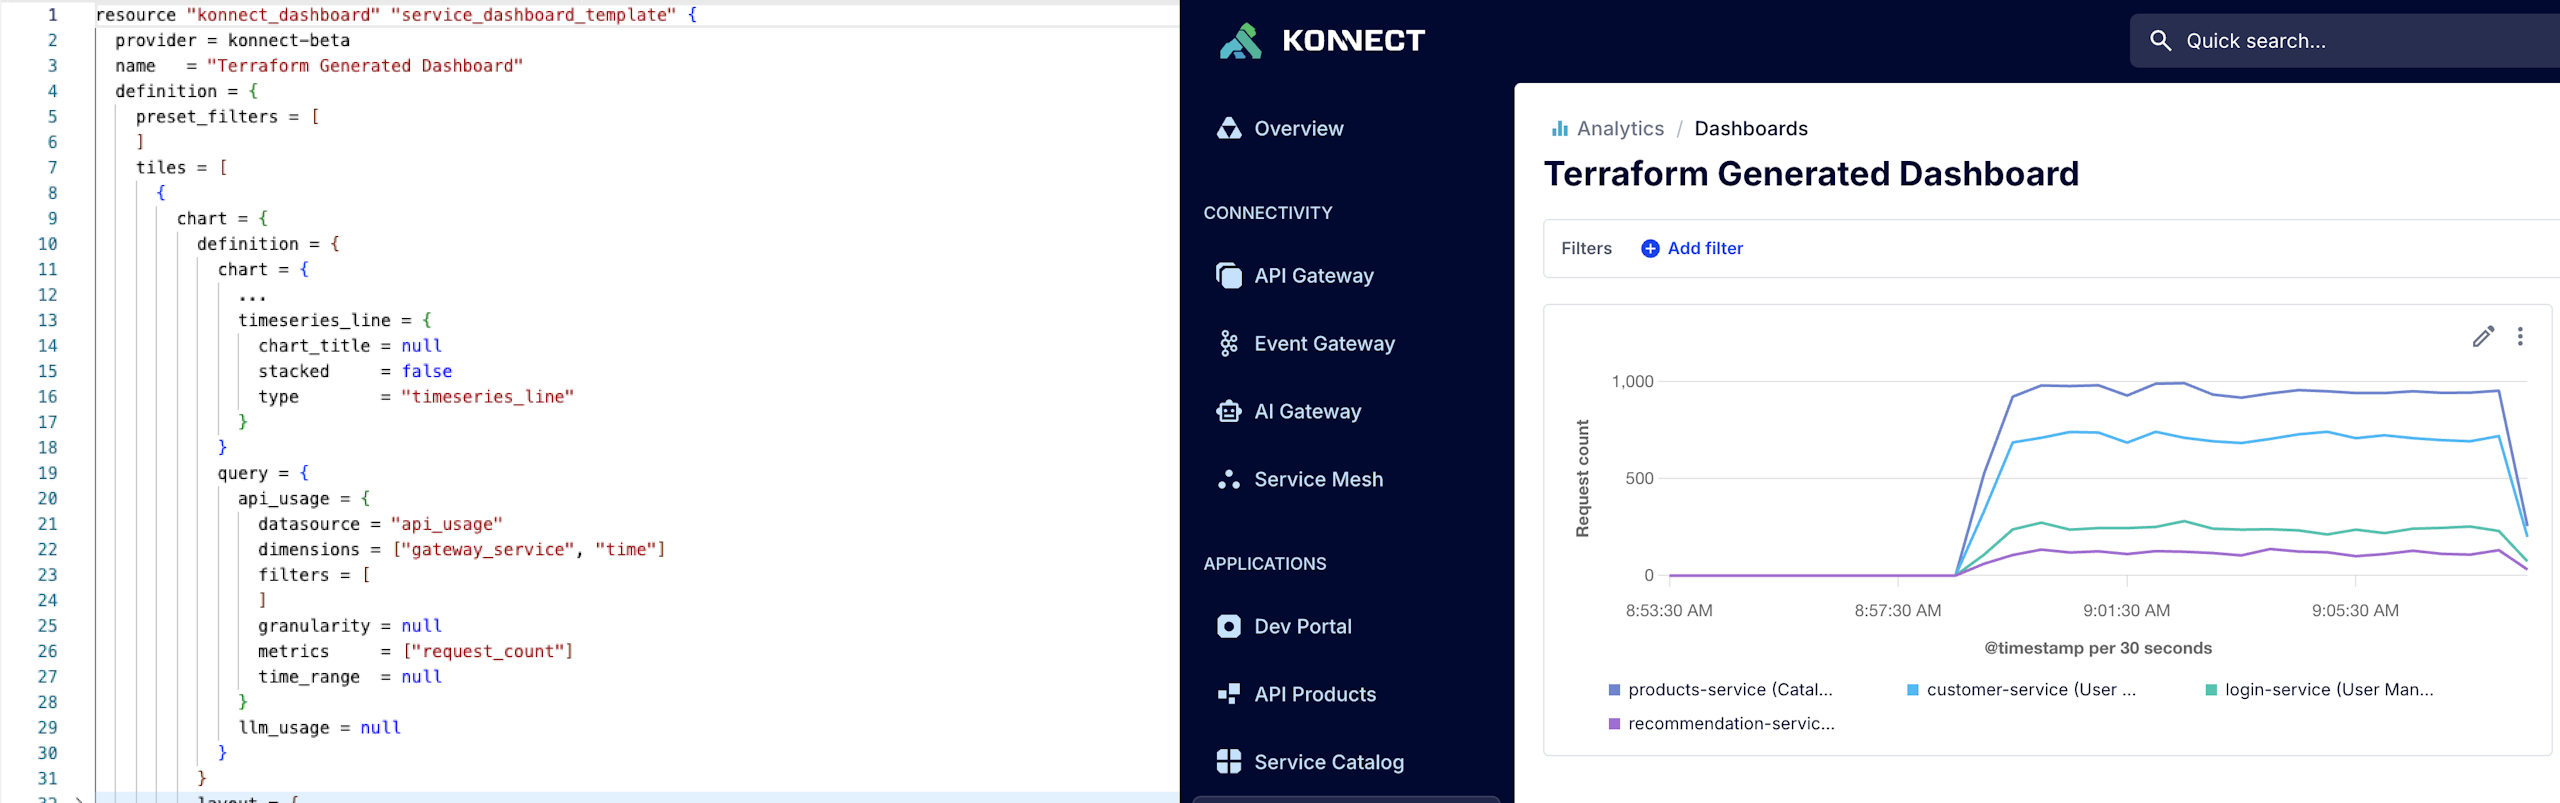
That is why we built Custom Dashboards, and today, we’re excited to share they're now generally available in Kong Konnect. With templates, global filters, role-based access, automation through APIs and Terraform, and built-in search, this release makes dashboards easy to get started with, adaptive to new needs, simple to share securely, and gives every team the view they need.